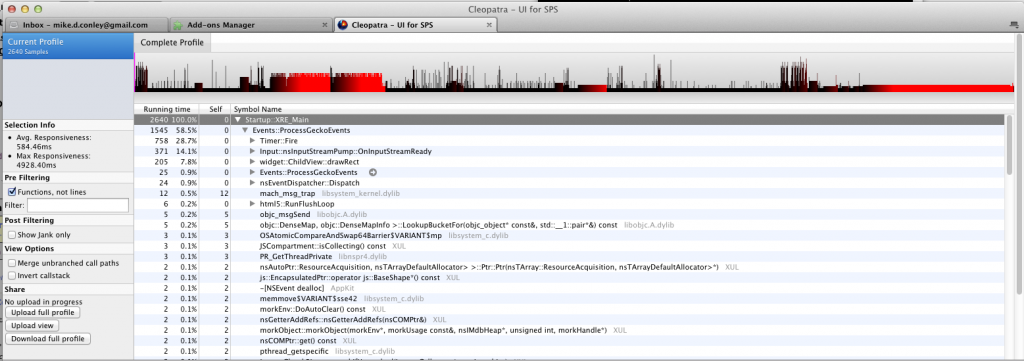
One of the first steps to making software snappier is knowing where the bottlenecks are. For Thunderbird, finding those bottlenecks has been hard – we haven’t had any tools to make drilling down to the slow bits easy.
Until now.
The platform folks have developed a really awesome profiler tool, and it’s been working really nicely in Firefox for some time now.
This past week, I spent a few hours making it work in Thunderbird.
If you’ve got a recent Daily of Thunderbird around, you can try it out right now.
How to bask in the glory of this awesome tool
- Make sure your Daily is recent. Anything built from today onwards should work.
- Install this add-on. It’s restartless!
- Check out your status bar. There should be two little panels there – “Disabled”, and “Dump Profile”
- Click on “Disabled” to switch the profiler into “Enabled” mode. Once you do that, it starts recording.
- Do some stuff, like check your mail…or do a search.
- Click on “Dump Profile”.
- A content tab will open that will show you profiling data gathered up to that point.
- Click on “Enabled” to disable the profiler – this will clear out the recording, to let you do a new one.
The web app that lets you browse the profile data is pretty sophisticated – you can read the skinny about it here.
Cooking with gas
On Windows or OSX, do an optimized, non-debug build of comm-central with the –enable-profiling flag set. Now you get super rich profiling data. Now you’re cookin’ with gas.
So hopefully this will be useful in making Thunderbird better, faster and stronger.
Big thanks to Benoit Gerard for his help and guidance porting the add-on, and the platform team for creating such a badass tool.
