While working on the ts_paint and tpaint regressions, we didn’t just stab blindly at the source code. We had some excellent tools to help us along the way. We also MacGyver‘d a few of those tools to do things that they weren’t exactly designed to do out of the box. And in some cases, we built new tools from scratch when the existing ones couldn’t cut it.
I just thought I’d write about those.
MattN’s Spreadsheet
I already talked about this one in my earlier post, but I think it deserves a second mention. MattN has mad spreadsheet skills. Also, it turns out you can script spreadsheets on Google Docs to do some pretty magical things – like pull down a bunch of talos data, and graph it for you.
I think this spreadsheet was amazingly useful in getting a high-level view of all of the performance regressions. It also proved very, very useful in the next set of performance challenges that came along – but more on those later.
MattN’s got a blog post up about his spreadsheet that you should check out.
The Gecko Profiler
This is a must-have for Gecko hackers who are dealing with some kind of performance problem. The next time I hit something performance related, this is the first tool I’m going to reach for. We used a number of tools in this performance work, but I’m pretty sure this was the most powerful one in our arsenal.
Very simply, Gecko ships with a built-in sampling profiler, and there’s an add-on you can install to easily dump, view and share these profiles. That last bit is huge – you click a button, it uploads, and bam – you have a link you can send to someone over IRC to have them look at your profile. It’s sheer gold.
We also built some tools on top of this profiler, which I’ll go into in a few paragraphs.
You can read up on the Gecko Profiler here at the official documentation.
Homebrew Profiler
At one point, jaws built a very simple profiler for the CustomizableUI component, to give us a sense of how many times we were entering and exiting certain functions, and how much time we were spending in them.
Why did we build this? To be honest, it’s been too long and I can’t quite remember. We certainly knew about the Gecko Profiler at this point, so I imagine there was some deficiency with the profiler that we were dealing with.
My hypothesis is that this was when we were dealing strictly with the ts_paint / tpaint regression on Windows XP. Take a look at the graphs in my last post again. Notice how UX (red) and mozilla-central (green) converge at around July 1st on Ubuntu? And how OS X finally converges on t_paint around August 1st?
I haven’t included the Windows 7 and 8 platform graphs, but I’m reasonably certain that at this point, Windows XP was the last regressing platform on these tests.
And I know for a fact that we were having difficulty using the Gecko Profiler on Windows XP, due to this bug.
Basically, on Windows XP, the call tree wasn’t interleaving the Javascript and native-code calls properly, so we couldn’t trust the order of tree, making the profile really useless. This was a serious problem, and we weren’t sure how to workaround it at the time.
And so I imagine that this is what prompted jaws to write the homebrew profiler. And it worked – we were able to find sections of CustomizableUI that were causing unnecessary reflow, or taking too long doing things that could be shortcutted.
I don’t know where jaws’ homebrew profiler is – I don’t have the patch on my machine, and somehow I doubt he does too. It was a tool of necessity, and I think we moved past it once we sorted out the Windows XP stack interleaving thing.
And how did we do that, exactly?
Using the Gecko Profiler on Windows XP
jaws profiler got us some good data, but it was limited in scope, since it only paid attention to CustomizableUI. Thankfully, at some point, Vladan from the Perf team figured out what was going wrong with the Gecko Profiler on Windows XP, and gave us a workaround that lets us get proper profiles again. I have since updated the Gecko Profiler MDN documentation to point to that workaround.
Reflow Profiles
This is where we start getting into some really neat stuff. So while we were hacking on ts_paint and tpaint, Markus Stange from the layout team wrote a patch for Gecko to take “reflow profiles”. This is a pretty big deal – instead of telling us what code is slow, a reflow profile tells us what things take a long time to layout and paint. And, even better, it breaks it down by DOM id!
This was hugely powerful, and I really hope something like this can be built into the Gecko Profiler.
Markus’ patch can be found in this bug, but it’ll probably require de-bitrotting. If and when you apply it, you need to run Firefox with an environment variable MOZ_REFLOW_PROFILE_FILE pointing at the file you’d like the profile written out to.
Once you have that profile, you can view it on Markus’ special fork of the Gecko Profiler viewer.
This is what a reflow profile looks like:
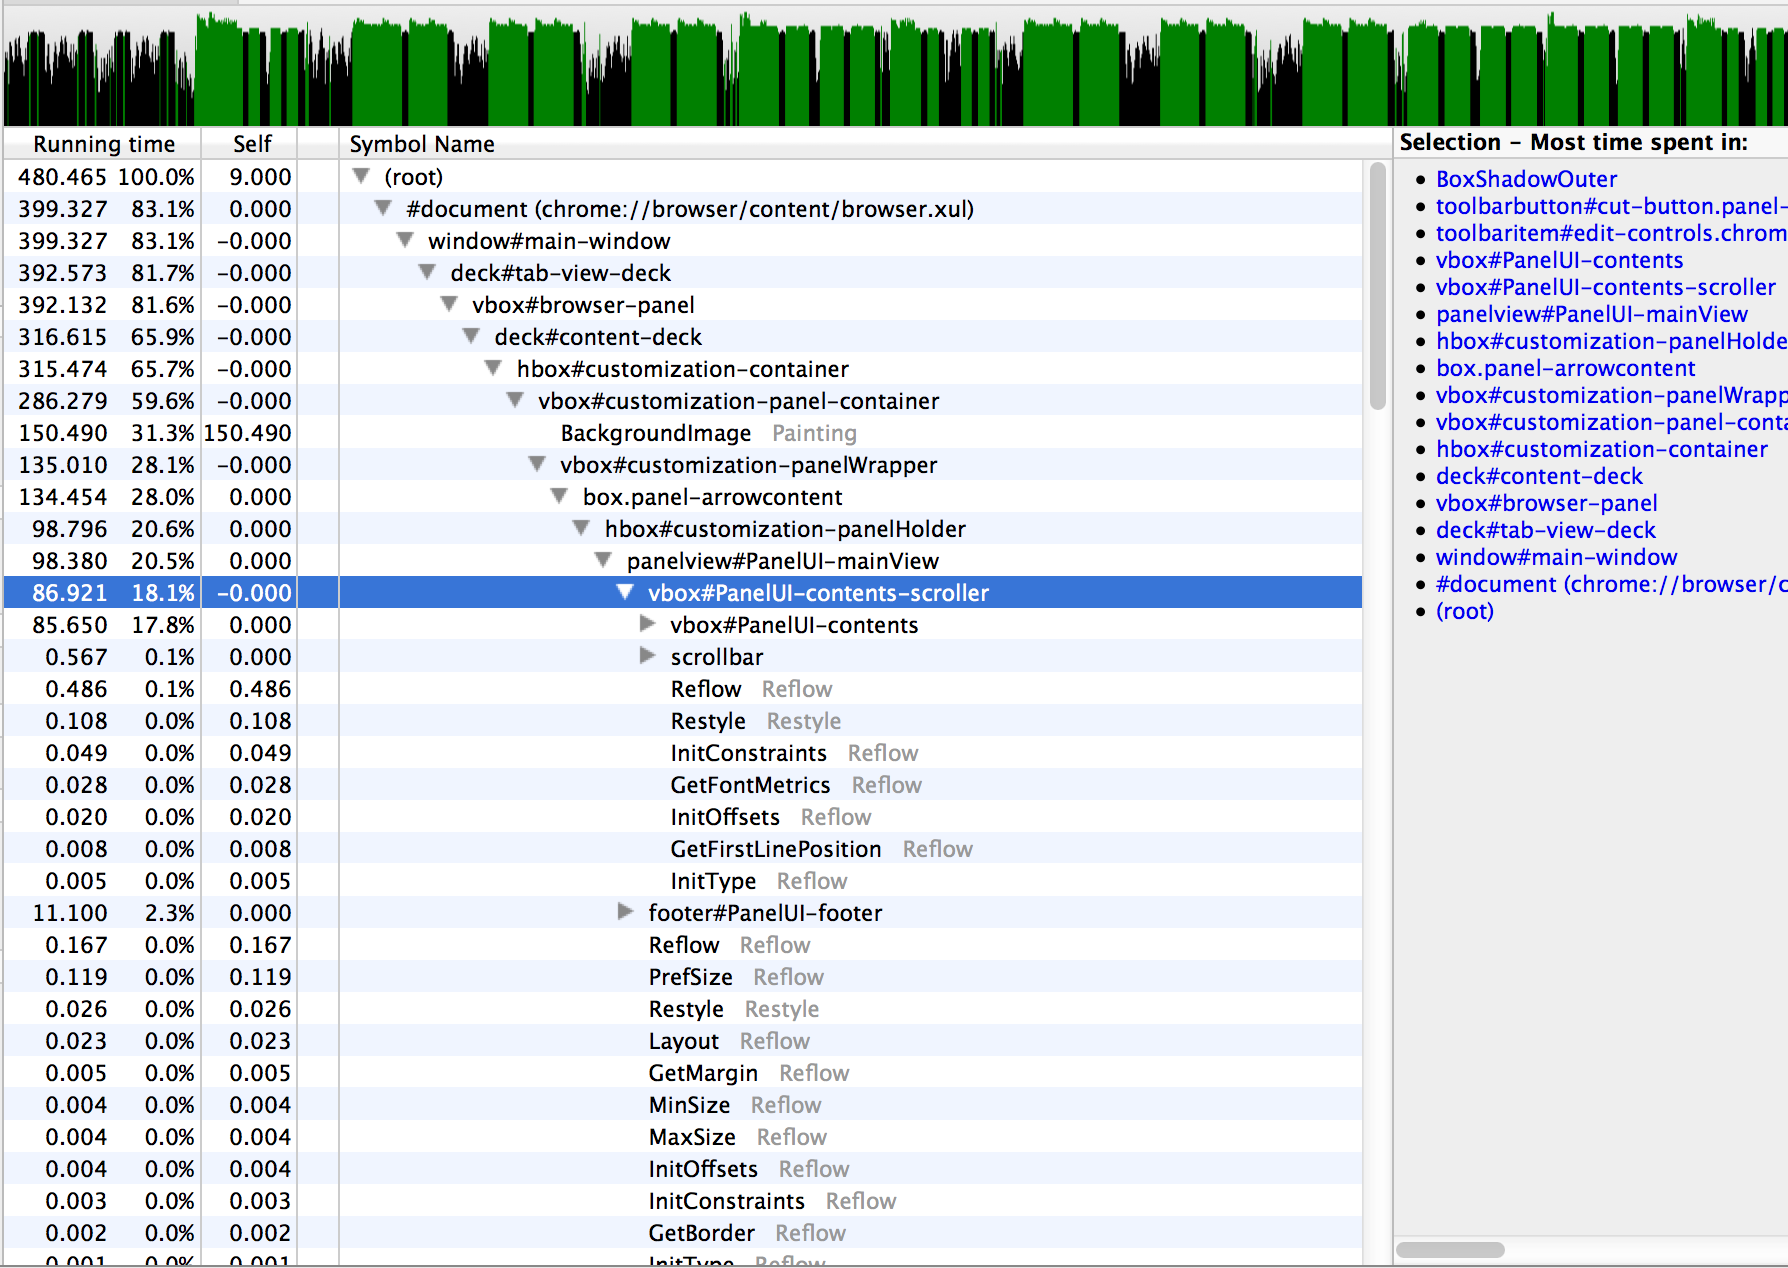
I haven’t linked to one I’ve shared because reflow profiles tend to be very large – too large to upload. If you’d like to muck about with a real reflow profile, you can download one of the reflow profiles attached to this bug and upload it to Markus’ Gecko Profiler viewer.
These reflow profiles were priceless throughout all of the Australis performance work. I cannot stress that enough. They were a way for us to focus on just a facet of the work that Gecko does – layout and painting – and determine whether or not our regressions lay there. If they did, that meant that we had to find a more efficient way to paint or layout. And if the regressions didn’t show up in the reflow profiles, that was useful too – it meant we could eliminate graphics and layout from our pool of suspects.
Comparison Profiles
Profiles are great, but you know what’s even better? Comparison profiles. This is some more Markus Stange wizardry.
Here’s the idea – we know that ts_paint and tpaint have regressed on the UX branch. We can take profiles of both the UX and mozilla-central. What if we can somehow use both profiles and find out what UX is doing that’s uniquely different and uniquely slow?
Sound valuable? You’re damn right it is.
The idea goes like this – we take the “before” profile (mozilla-central), and weight all of its samples by -1. Then, we add the samples from the “after” profile (UX).
The stuff that is positive in the resulting profile is an indicator that UX is slower in that code path. The stuff that is negative means that UX is faster.
How did we do this? Via these scripts. There’s a script in this repository called create_comparison_profile.py that does all of the work in generating the final comparison profile.
Here’s a comparison profile to look at, with mozilla-central as “before” and UX as “after”.
Now I know what you’re thinking – Mike – the root of that comparison profile is a negative number, so doesn’t that mean that UX is faster than mozilla-central?
That would seem logical based on what I’ve already told you, except that talos consistently returns the opposite opinion. And here’s where I expose some ignorance on my part – I’m simply not sure why that root node is negative when we know that UX is slower. I never got a satisfying answer to that question. I’ll update this post if I find out.
What I do know is that drilling into the high positive numbers of these comparison profiles yielded very valuable results. It allowed us to quickly determine what was unique slow about UX.
And in performance work, knowing is more than half the battle – knowing what’s slow is most of the battle. Fixing it is often the easy part – it’s the finding that’s hard.
Oh, and I should also point out that these scripts were able to generate comparison profiles for reflow profiles as well. Outstanding!
Profiles from Talos
Profiling locally is all well and good, but in the end, if we don’t clear the regressions on the talos hardware that run the tests, we’re still not good enough. So that means gathering profiles on the talos hardware.
So how do we do that?
Talos is not currently baked into the mozilla-central tree. Instead, there’s a file called testing/talos/talos.json that knows about a talos repository and a revision in that repository. The talos machines then pull talos from that repository, check out that revision, and execute the talos suites on the build of Firefox they’ve been given.
We were able to use this configuration to our advantage. Markus cloned the talos repository, and modified the talos tests to be able to dump out both SPS and reflow profiles into the logs of the test runs. He then pushed those changes to his user repository for talos, and then simply modified the testing/talos/talos.json file to point to his repo and the right revision.
The upshot being that Try would happily clone Markus’ talos, and we’d get profiles in the test logs on talos hardware! Brilliant!
Now we were cooking with gas – reflow and SPS profiles from the test hardware. Could it get better?
Actually, yes.
Getting the Good Stuff
When the talos tests run, the stuff we really care about is the stuff being timed. We care about how long it takes to paint the window, but not how long it takes to tear down the window. Unfortunately, things like tearing down the window get recorded in the SPS and reflow profiles, and that adds noise.
Wouldn’t it be wonderful to get samples just from the stuff we’re interested in? Just to get samples only when the talos test has its stopwatch ticking?
It’s actually easier than it sounds. As I mentioned, Markus had cloned the talos tests, and he was able to modify tpaint and ts_paint to his liking. He made it so that just as these tests started their stopwatches (waiting for the window to paint), an SPS profile marker was added to the sample taken at that point. A profile marker simply allows us to decorate a sample with a string. When the stopwatch stopped (the window has finished painting), we added another marker to the profile.
With that done, the extraction scripts simply had to exclude all samples that didn’t occur between those two markers.
The end result? Super concentrated profiles. It’s just the stuff we care about. Markus made it work for reflow profiles too – it was really quite brilliant.
And I think that pretty much covers it.
Lessons
- If you don’t have the tools you need, go get them.
- If the tools you need don’t exist, build them, or find someone who can. That someone might be Markus Stange.
- If the tools you need are broken, fix them, or find someone who can.
So with these amazing tools we were eventually able to grind down our ts_paint and tpaint regressions into dust.
And we celebrated! We were very happy to clear those regressions. We were all clear to land!
Or so we thought. Stay tuned for Part 4.