Author Archives: Mike Conley

Review Board Issue Tracking: A Sneak Peek

So I wrote my (hopefully) last mid-term ever last night, and in celebration, I thought I’d put together a little video showing off the issue tracking feature I’m hoping to put into Review Board.

It’s still in it’s very early stages.  The code hasn’t been reviewed.  I’m still really really open to suggestions and feedback on this.  So please, comment here, or on the reviewboard-dev list.

So here it is – enjoy!

(Click here if you can’t see the video)

Still Here

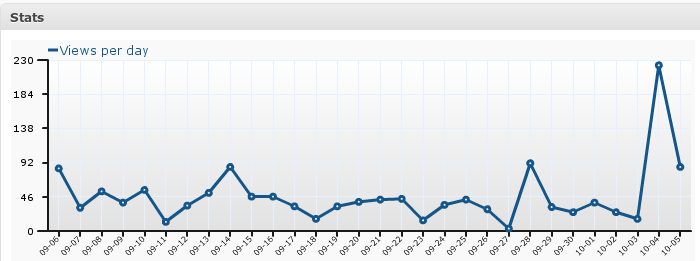
For some reason or another, a traffic spike hit my blog yesterday:

I’m not entirely sure what people are interested in, but my last post was kind of lackluster and I’m sorry it’s the one people are seeing when they stop by.

It’s like having a bunch of marathon runners pass by your house, and you’ve got scaffolding and busted down cars all over your lawn.  It’s embarrassing.

So, to rectify, here’s what I’ve got going on right now:

  1. I’m still in thesis-writing mode.  I’ve knocked out a few large sections, but there’s still plenty to do.  Trying to pick at it at least once a day for a few hours.  LaTeX frustrations aside, things are moving forward OK here.
  2. UCOSP, the cross-Canada capstone course that I’m TA-ing this semester, is in full swing.  Last weekend was the code sprint, and I stepped in to mentor the Review Board team, since the core developers were too swamped to make the weekend trip.  It was good times.  Here’s a blog post about it by Andrew Louis, who helped organize the whole thing.
  3. I’m in a computer graphics course this semester.  I just finished the first written assignment for it.  Linear algebra is awesome, but I haven’t done it in years, so I’ve had to really shake out the cobwebs on this one.
  4. The Johnson Report is learning a slew of new cover material for an upcoming show.
  5. It’s already October, which means that my planned graduation is only a few months away.  I’ll be looking for work soon, and should update my CV.

And that’s about it, as far as I can tell.

Now what are people so damn interested in on my blog?

Starting My Thesis

So I’ve been given the go-ahead to start writing my thesis.  I was going to post up some more exciting numbers/findings from my experiment, but that’ll have to wait – the thesis beckons.

I’ve started writing it, and holy smokes, it’s hard.  It’s hard because I have to zoom out from my current perspective, and start right from scratch, explaining where every single decision came from.

And I have to do it in a formal, academic tone – without awesome photos.

Plan of Attack

I think I’m going to go with Alecia on this one, and start with my outline.  That’s what I always did for any of my Drama classes where I had to write a big essay:  start with the outline, and treat it like the skeleton…then slowly put more flesh on the skeleton.  Keep fleshing it out, throw on some skin, some clothes, a lick of varnish, and bam:  it’s all done.

Anyhow, that’s my plan of attack.  So I need an outline.  Let me show you what I have.

Tentative Outline

  1. Intro
    1. Title Page
    2. Abstract
    3. Acknowledgments
    4. Table of Contents
    5. List of Tables (where applicable)
    6. List of Plates (where applicable)
    7. List of Figures
    8. List of Appendices (where applicable)
  2. The Meat
    1. Background
      1. Code Review
          1. What it is, how it is commonly used in industry
          2. Proven to be effective (Jason Cohen study)
          3. Helps to spread learning in a development team
        1. If code review is so good at spreading learning, why isn’t it part of the pedagogy in the undergrad curriculum?
            1. How do we teach it?
            2. The curriculum is already packed – how do we fit it in?
            3. Joorden’s and Pare’s peerScholar approach
          1. The idea:
              1. Have students evaluate one another after assignments, and give them a code review grade based on agreement with the TA grades.
          2. Unanswered questions:
            1. Would students actually benefit from this idea?
            2. What is the relationship between the marks given by TAs, and the marks given by student evaluators?
            3. How would students feel about grading one another?
          3. The experiment
            1. Terminology
              1. Assignment specification
              2. Submission
              3. Subject
              4. Grader
              5. Peer Grader
              6. Marking
              7. Marking Rubric
              8. Peer Average
              9. Agreement
            2. Design
              1. Single-blind, with two groups (control and treatment)
                1. In both groups, subjects would:
                2. fill out brief questionnaire
                3. work on two programming assignments
                4. have a maximum of half an hour to complete each assignment
                5. perform another activity during the time between assignments, dependent on their particular group:
                  1. treatment group would perform some grading
                  2. control group would work on a vocabulary exercise
              2. Subjects in the treatment group would then fill out a post-experiment questionnaire to get their feedback on their marking experience
              3. Counter-balancing?
              4. Graders would mark shuffled submissions
              5. Graders would choose their preferred submission
            3. Instruments
              1. Pre-experiment Questionnaire
              2. Assignment Specifications
                1. Flights and Passengers
                2. Decks and Cards
              3. Assignment Rubrics
              4. Mock-ups
              5. Vocabulary Exercise
              6. Post-experiment Questionnaire
              7. Working Environment
                1. IDE
                2. Count-down widget
                3. Screen capture
            4. Subjects
              1. Undergraduates with 4+ months of Python programming experience
              2. Months as a unit of experience
              3. The two graders
            5. Assignment Sessions
              1. Greeting, informed consent, withdrawal rights
              2. Pre-experiment questionnaire
              3. First Assignment Rules
                1. 30 minutes maximum – finish early, let me know
                2. full access to Internet
                3. work may or may not be seen by other participants in the study
                4. may ask for clarification
              4. First Assignment begins
                1. Timer widget starts
                2. Screen capture begins
                3. Subject left alone
              5. Marking / vocabulary phase
                1. Treatment group
                  1. Would be given 5 submissions (secretly mock-ups), given 5 rubrics, asked to fill out as much as possible
                  2. 30 minute time limit
                2. Control group
                  1. Given links to 5 vocabulary exercises found online
                  2. Asked to complete as much as possible, and to self-report results on a sheet of paper
                  3. 30 minute time limit
              6. Second Assignment Rules
                1. Same as first, but repeated for emphasis
              7. Second Assignment begins
                1. Timer widget starts
                2. Screen capture begins
                3. Subject left alone
              8. Control group subjects released
              9. Treatment group subjects fill out post-experiment questionnaire
            6. Grading
              1. Initial meeting, and then hand-off of submissions / rubrics
              2. Hands-off approach
            7. Choosing Phase
              1. Submissions for each assignment were paired by the subject that wrote them
              2. Mock-ups not included
              3. Graders were asked to choose which one they preferred, and give a rating of the difference
          4. Analysis
            1. Pearson’s Correlation Co-efficient as a measure of agreement
            2. Fisher’s z-score
          5. Results
            1. On grader vs. grader agreement
            2. On grader vs. peer average agreement
            3. On treatment vs. control
              1. Difference in average
              2. Grader preference
            4. On student opinion wrt peer grading
          6. Discussion
          7. Threats to validity
            1. The 30 minute time limit
            2. A rigid rubric
          8. Future work
          9. Conclusion

        That’s the current structure of it.  I’m meeting my supervisor tomorrow and getting feedback, so this might change.  Stay tuned.

        Some More Results: Did the Graders Agree? – Part 2

        (Click here to read the first part of the story)

        I’m just going to come right out and say it:  I’m no stats buff.

        Actually, maybe that’s giving myself too much credit.  I barely scraped through my compulsory statistics course.  In my defense, the teaching was abysmal, and the class average was in the sewer the entire time.

        So, unfortunately, I don’t have the statistical chops that a real scientist should.

        But, today, I learned a new trick.

        Pearson’s Correlation Co-efficient

        Joorden’s and Pare gave me the idea while I was reviewing their paper for the Related Work section of my thesis.  They used it in order to inspect mark agreement between their expert markers.

        In my last post on Grader agreement, I was looking at mark agreement at the equivalence level.  Pearson’s Correlation Co-efficient should (I think) let me inspect mark agreement at the “shape” level.

        And by shape level, I mean this:  if Grader 1 gives a high mark for a participant, then Grader 2 gives a high mark.  If Grader 1 gives a low mark for the next participant, then Grader 2 gives a low mark.  These high and low marks might not be equal, but the basic shape of the thing is there.

        And this page, with it’s useful table, tell me how I can tell if the correlation co-efficient that I find is significant.  Awesome.

        At least, that’s my interpretation of Pearson’s Correlation Co-efficient.  Maybe I’ve got it wrong.  Please let me know if I do.

        Anyhow, it can’t hurt to look at some more tables.  Let’s do that.

        About these tables…

        Like my previous post on graders, I’ve organized my data into two tables – one for each assignment.

        Each table has a row for that assignments criteria.

        Each table has two columns – the first is strictly to list the assignment criteria.  The second column gives the Pearson Correlation Co-efficient for each criterion.  The correlation measurement is between the marks that my two Graders gave on that criterion across all 30 submissions for that assignment.

        I hope that makes sense.

        Anyways, here goes…

        Da-ta!

        Decks and Cards Grader Correlation Table

        [table id=8 /]

        Flights and Passengers Grader Correlation Table

        [table id=9 /]

        What does this tell us?

        Well, first off, remember that for each assignment, for each criterion, there were 30 submissions.

        So N = 30.

        In order to determine if the correlation co-efficients are significant, we look at this table, and find N – 2 down the left hand side:

        28                       .306    .361    .423    .463

        Those 4 values on the right are the critical values that we want to pass for significance.

        Good news!  All of the correlation co-efficients fall within the range of [.306, .463].  So now, I’ll show you their significance by level:

        p < 0.10

        • Design of __str__ in Decks and Cards assignment

        p < 0.05

        • Design of deal method in Decks and Cards assignment

        p < 0.02

        • Design of heaviest_passenger method in Flights and Passengers

        p < 0.01

        Decks and Cards
        • Design of Deck constructor
        • Style
        • Internal Comments
        • __str__ method correctness
        • deal method correctness
        • Deck constructor correctness
        • Docstrings
        • shuffle method correctness
        • Design of shuffle method
        • Design of cut method
        • cut method correctness
        • Error checking
        Flights and Passengers
        • Design of __str__ method
        • Design of lightest_passenger method
        • Style
        • Design of Flight constructor
        • Internal comments
        • Design of add_passenger method
        • __str__ method correctness
        • Error checking
        • heaviest_passenger method correctness
        • Docstrings
        • lightest_passenger method correctness
        • Flight constructor correctness
        • add_passenger method correctness

        Wow!

        Correlation of Mark Totals

        Joorden’s and Pare ran their correlation statistics on assignments that were marked on a scale from 1 to 10.  I can do the same type of analysis by simply running Pearson’s on the totals for each participant by each Grader.

        Drum roll, please…

        Decks and Cards

        p(28) = 0.89, p < 0.01

        Flights and Passengers

        p(28) = 0.92, p < 0.01

        Awesome!

        Summary / Conclusion

        I already showed before that my two Graders rarely agreed mark for mark, and that one Grader tended to give higher marks than the other.

        The analysis with Pearson’s correlation co-efficient seems to suggest that, while there isn’t one-to-one agreement, there is certainly a significant correlation – with the majority of the criteria having a correlation with p < 0.01!

        The total marks also show a very strong, significant, positive correlation.

        Ok, so that’s the conclusion here:  the Graders marks do not match, but show moderate to high positive correlation to a significant degree.

        How’s My Stats?

        Did I screw up somewhere?  Am I making fallacious claims?  Let me know – post a comment!