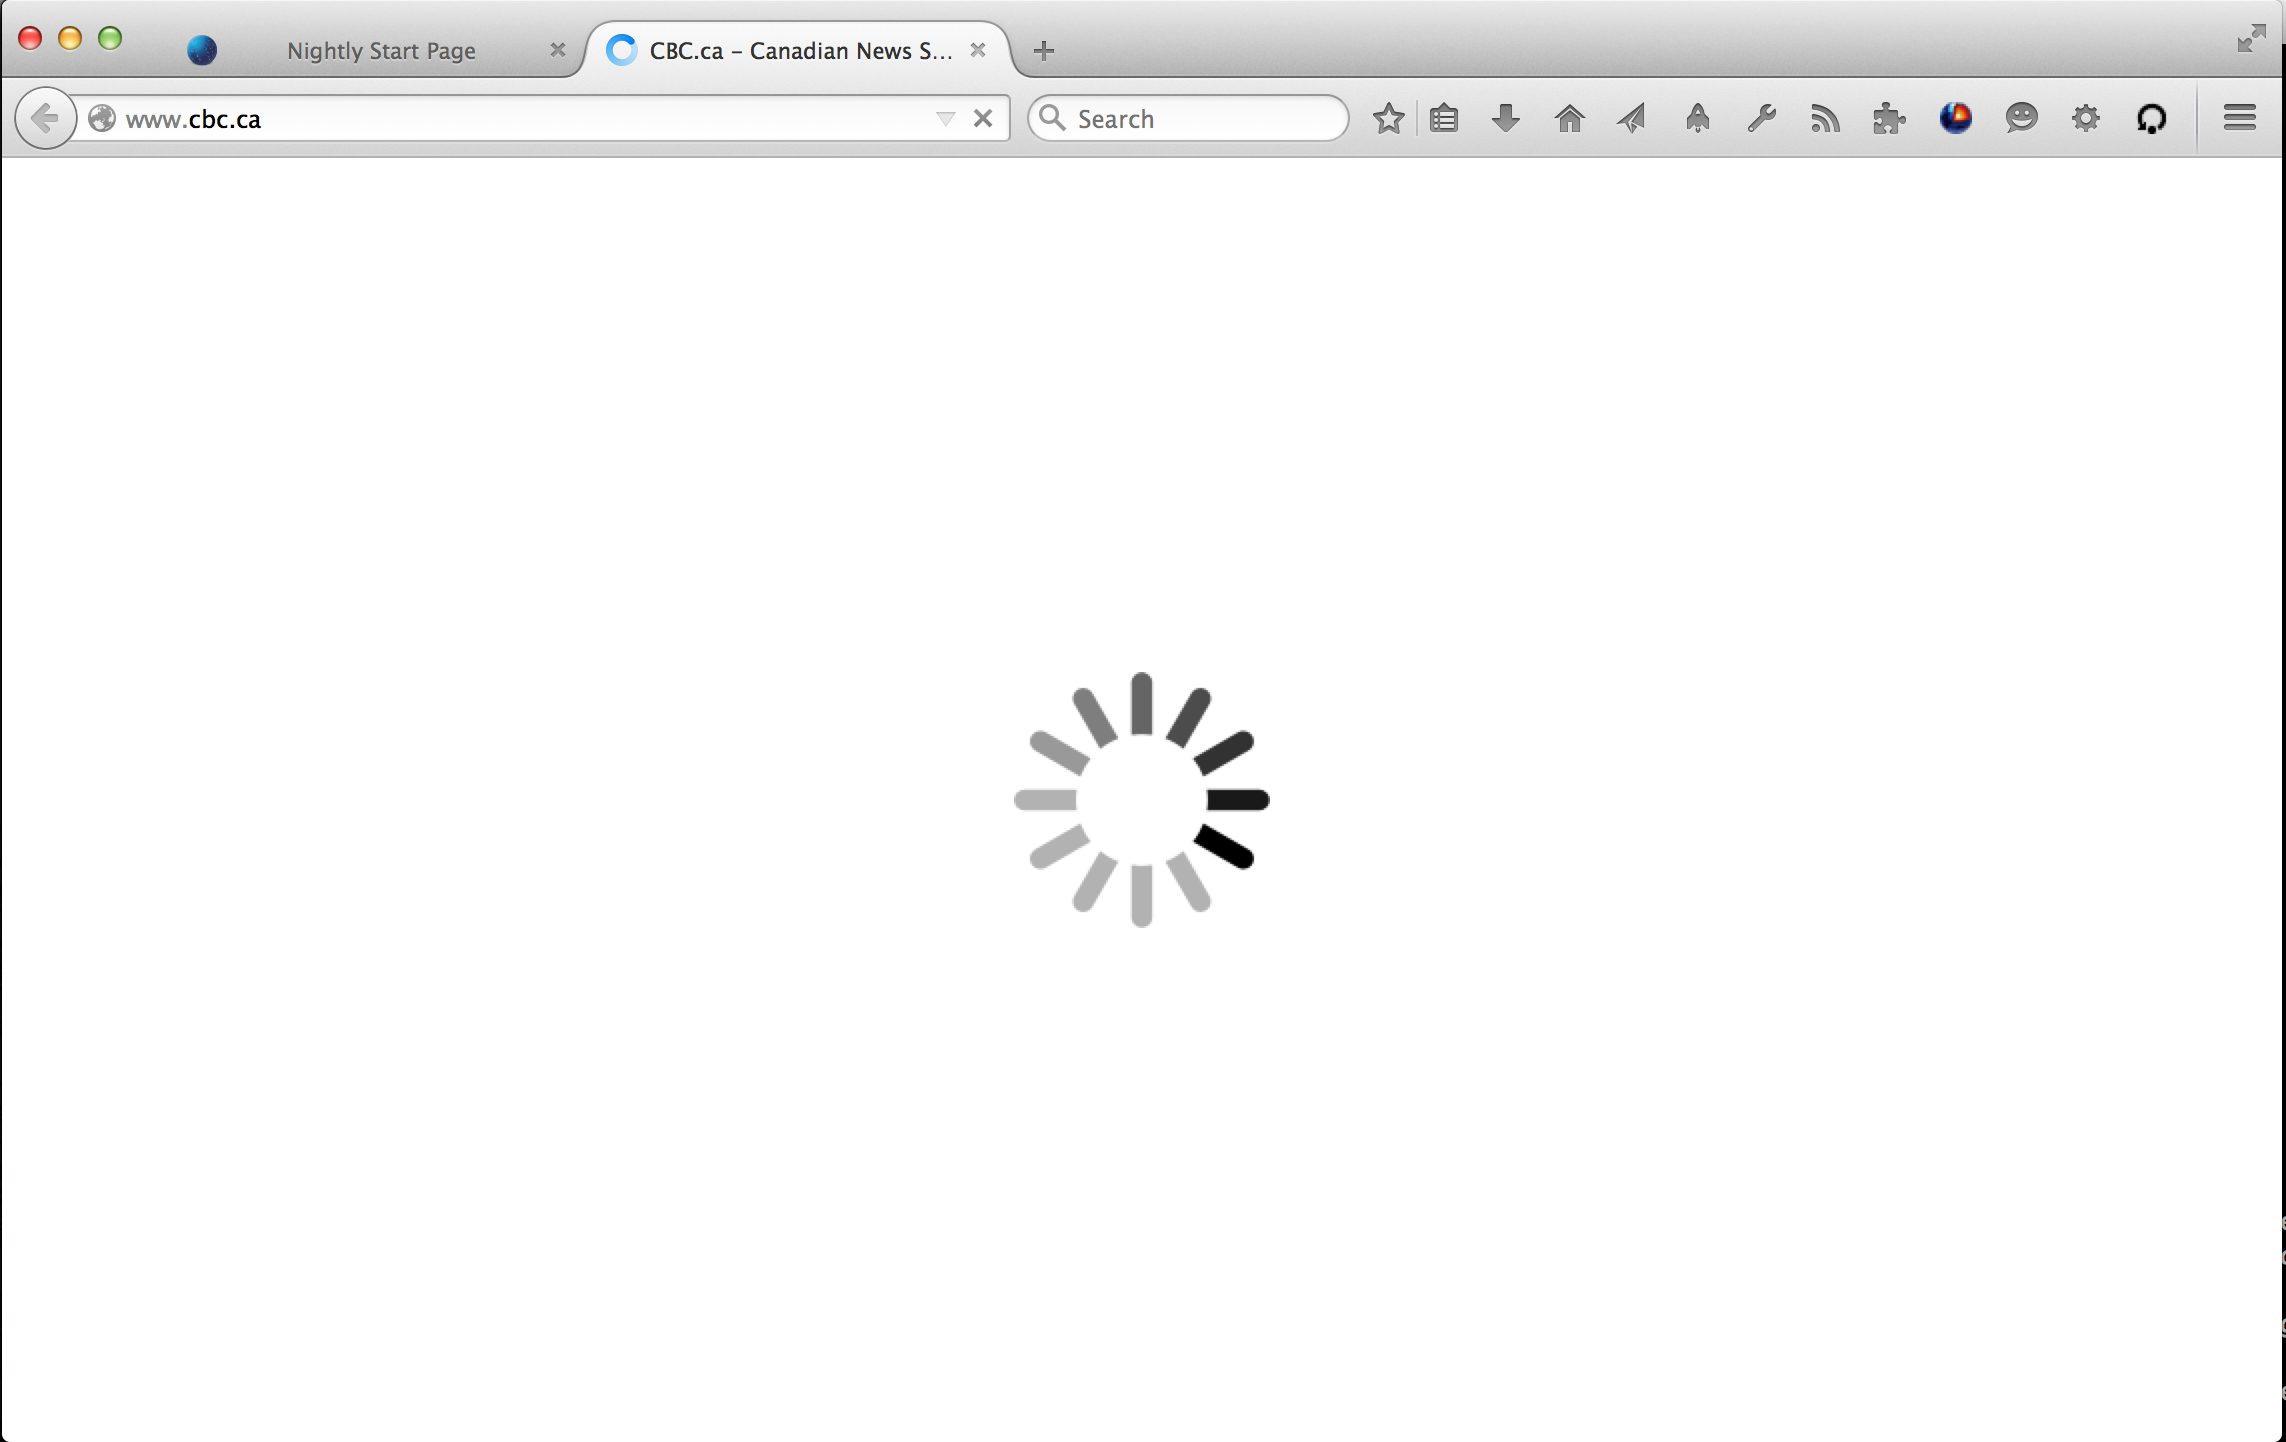
Have you been using Firefox Nightly and seen this big annoying spinner?
Aw, crap. You again.
I hate that thing. I hate it.

Me, internally, when I see the spinner.
And while we’re working on making the spinner itself less ugly, I’d like to eliminate, or at least reduce its presence to the absolute minimum.
How do I do that? Well, first, know your enemy.
What does it even mean?
That big spinner means that the graphics part of Gecko hasn’t given us a frame yet to paint for this browser tab. That means we have nothing yet to show for the tab you’ve selected.
In the single-process Firefox that we ship today, this graphics operation of preparing a frame is something that Firefox will block on, so the tab will just not switch until the frame is ready. In fact, I’m pretty sure the whole browser will become unresponsive until the frame is ready.
With Electrolysis / multi-process Firefox, things are a bit different. The main browser process tells the content process, “Hey, I want to show the content associated with the tab that the user just selected”, and the content process computes what should be shown, and when the frame is ready, the parent process hears about it and the switch is complete. During that waiting time, the rest of the browser is still responsive – we do not block on it.
So there’s this window of time where the tab switch has been requested, and when the frame is ready.
During that window of time, we keep showing the currently selected tab. If, however, 300ms passes, and we still haven’t gotten a frame to paint, that’s when we show the big spinner.
So that’s what the big spinner means – we waited 300ms, and we still have no frame to draw to the screen.
How bad is it?
I suspect it varies. I see the spinner a lot less on my Windows machine than on my MacBook, so I suspect that performance is somehow worse on OS X than on Windows. But that’s purely subjective. We’ve recently landed some Telemetry probes to try to get a better sense of how often the spinner is showing up, and how laggy our tab switching really is. Hopefully we’ll get some useful data out of that, and as we work to improve tab switch times, we’ll see improvement in our Telemetry numbers as well.
Where is the badness coming from?
This is still unclear. And I don’t think it’s a single thing – many things might be causing this problem. Anything that blocks up the main thread of the content process, like slow JavaScript running on a web-site, can cause the spinner.
I also seem to see the spinner when I have “many” tabs open (~30), and have a build going on in the background (so my machine is under heavy load).
Maybe we’re just doing things inefficiently in the multi-process case. I recently landed profile markers for the Gecko Profiler for async tab switching, to help figure out what’s going on when I experience slow tab switch. Maybe there are optimizations we can make there.
One thing I’ve noticed is that there’s this function in the graphics layer, “ClientTiledLayerBuffer::ValidateTile”, that takes much, much longer in the content process than in the single-process case. I’ve filed a bug on that, and I’ll ask folks from the Graphics Team this week.
How you can help
UPDATE (June 1, 2015): Getting profiles from Windows is currently broken because the symbol server appears to be busted. Any profiles from Windows machines will be useless until this bug is fixed. Alternatively, set profiler.symbolicationUrl to http://symbolapi.mocotoolsstaging.net in about:config.
If you’d like to help me find more potential causes, Profiles are very useful! NOTE – I don’t mean “user profiles”, as in, your bookmarks / customizations / history, etc, in the profile folder. I don’t mean this thing. I mean a performance profile.
A performance profile is a read-out of everything that Firefox / Gecko is doing over a particular span of time. When the profiler is running, Firefox / Gecko will record where the process is in the stack every 1ms or so. It’ll also record information about how long since it’s serviced the event loop, which helps us find jank.
To help, grab the Gecko Profiler add-on, make sure it’s enabled, and then dump a profile when you see the big spinner of doom. The interesting part will be between two markers, “AsyncTabSwitch:Start” and “AsyncTabSwitch:Finish”. There are also markers for when the parent process displays the spinner – “AsyncTabSwitch:SpinnerShown” and “AsyncTabSwitch:SpinnerHidden”. The interesting stuff, I believe, will be in the “Content” section of the profile between those markers. Here are more comprehensive instructions on using the Gecko Profiler add-on.
And here’s a video of me demonstrating how to use the profiler, and how to attach a profile to the bug where we’re working on improving tab switch times:
And here’s the link I refer you to in the video for getting the add-on.
So hopefully we’ll get some useful data, and we can drive instances of this spinner into the ground.
I’d really like that.