Continued from Part 1.
So we’d just gotten Talos data in, and it looked like we were regressing on ts_paint and tpaint right across the board.
Speaking just for myself, up until this point, Talos had been a black box. I vaguely knew that Talos tests were run, and I vaguely understood that they measured certain performance things, but I didn’t know what those things were nor where to look at the results.
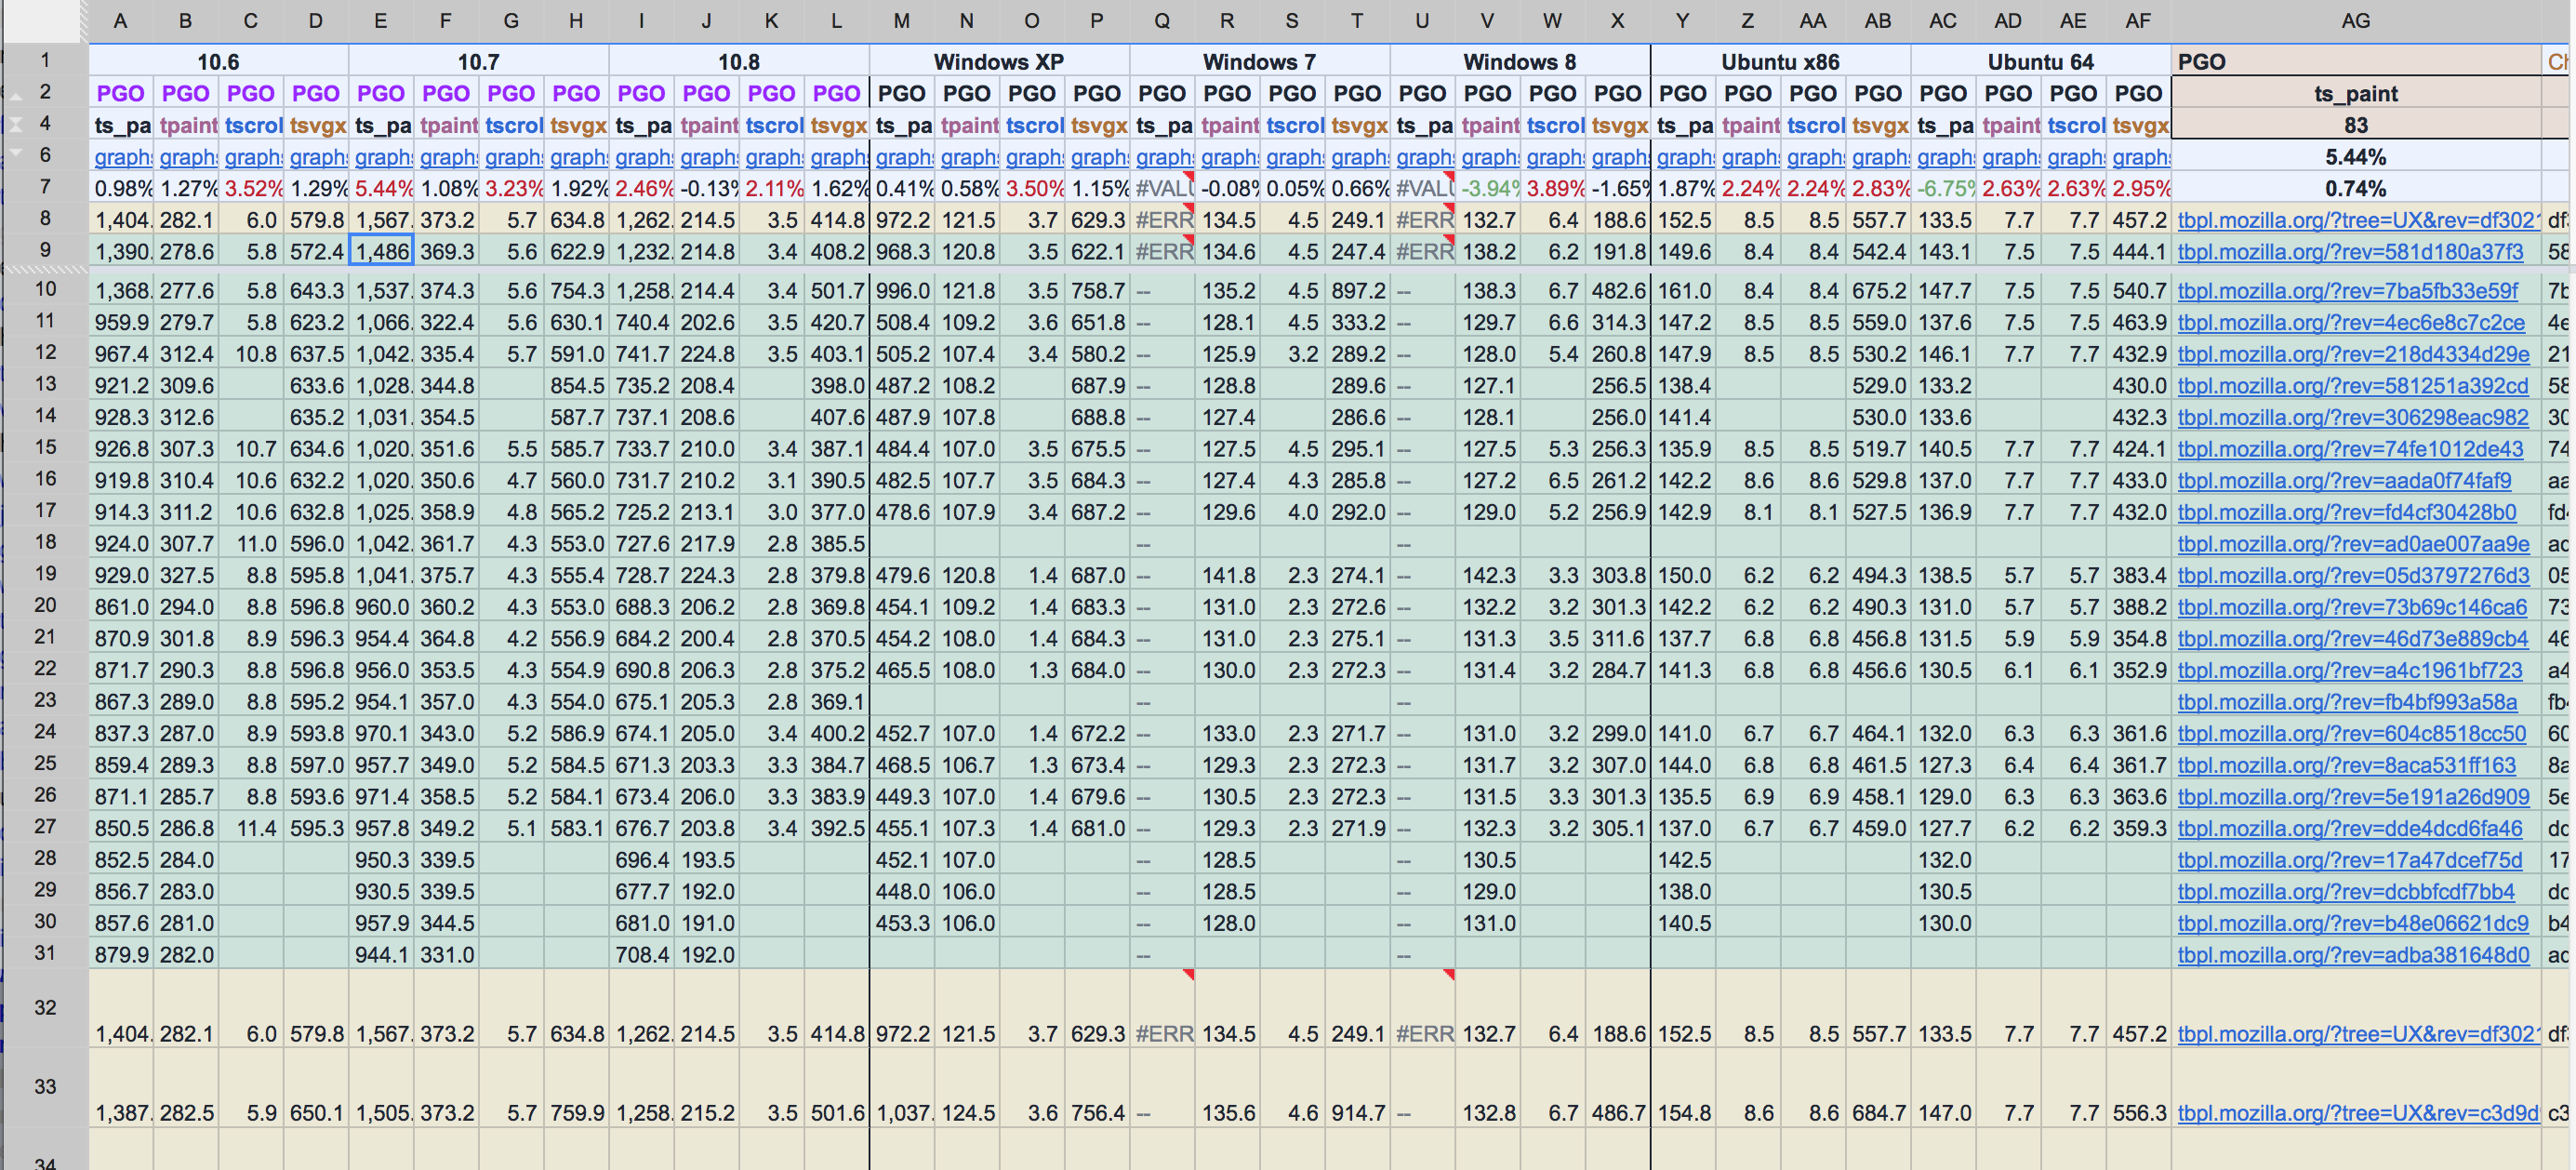
Luckily, I was working with some pretty seasoned veterans. MattN whipped up an amazing spreadsheet that dynamically pulled in the Talos test data for each platform so that we could get a high-level view of all of the regressions. This would turn out to be hugely useful.
Here’s a link to a read-only version of that spreadsheet in all of its majesty. Or, if that link is somehow broken in the future, here’s a screenshot:
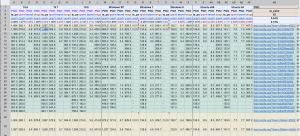
Numbers!
So now we had a high-level view of the regressions. The next step was determining what to do about it.
I should also mention that these regressions, at this point, were the only big things blocking us from landing on mozilla-central. So naturally, a good chunk of us focused our attention on this performance stuff. We quickly organized a daily standup meeting time where we could all get together and give reports on what we were doing to grind down the performance issues, and what results we were getting from our efforts.
That chunk of team, however, didn’t initially include me. I believe Gijs, Unfocused, mikedeboer and myself kept hacking on customization and widget bugs while jaws and MattN dug at performance. As time went on though, a few more of us eventually joined MattN and jaws in their performance work.
The good news in all of this is that ts_paint and tpaint are related – both measure the time it takes from issuing the command to open a browser window to actually painting it on the screen. ts_paint is concerned with the very first Firefox window from a cold-start, and tpaint is concerned with new windows from an already-running Firefox. It was quite possible that there was some overlap in what was making us slow on these two tests, which was somewhat encouraging.
The following bugs are just a subset of the bugs we filed and landed to improve our ts_paint and tpaint performance. Looking back, I’m pretty sure these are the ones that made the most difference, but the full list can be found as dependencies of these bugs.
Bug 890105 – TabsInTitleBar._update should group measurements and style changes to avoid unnecessary reflows
After a bit of examination, MattN dealt the first blow when he filed Bug 890105. The cross-platform code that figures out how best to place the tabs in the titlebar (while taking into account things like the system font size) is run before the window first paints, and it was being inefficient.
By inefficient, I mean it was causing more reflows than necessary. Here’s some information on reflows. The MDN page states that the article is obsolete, but the page still does a pretty good job of explaining what a reflow is.
The code would take a measurement of something on the page (causing a reflow), update that thing’s size (causing a reflow), and then repeat the process. MattN found we could cluster the measurements into a single pass, and then do all of the changes one after another. This reduced the number of reflows, which helped speed up both ts_paint and tpaint.
And boom, we saw our first win for both ts_paint and tpaint!
Bug 892532 – Add an optional fast-path to CustomizableUI.isWidgetRemovable
jaws found the next big win using a home-brewed profiler. The home-brewed profiler simply counted the number of times we entered and exited various functions in the CustomizableUI code, and recorded the time it took from entering to exiting.
I can’t really recall why we didn’t use the SPS profiler at this point. We certainly knew about it, but something tells me that at this point, we were having a hard time getting useful data from it.
Anyhow, with the home-brew profiler, jaws determined that we had the opportunity to fast-path a section of our code. Basically, we had a function that takes the ID of a widget, looks for and retrieves the widget, and returns whether or not that widget can be removed from its current location. There were some places that called this function during window start-up, and those places already had the widget that was to be found. jaws figured we could fast-path the function by being able to pass the widget itself rather than the ID, and skip the look-up.
Bug 891104 – Skip calling onOverflow during startup if there wasn’t any overflowed content before the toolbar is fully initialized
It was MattN’s turn again – this time, he found that the overflow toolbar code for the nav-bar (this is the stuff that handles putting widgets into the overflow panel if the window gets too small) was running the overflow handler as soon as the nav-bar was initted, regardless of whether anything was overflowed. This was causing a reflow because a measurement was on the overflowable toolbar to see if items needed to be moved into the overflow panel.
Originally, the automatic call of the overflow handler was to account for the case where the nav-bar is overflowed from the very beginning – but jaws made it smarter by attaching an overflow handler before the CSS attribute that made the toolbar overflowable was applied. That meant that if the nav-bar would only call the overflow handler if it really needed to, as opposed to every time.
Bug 898126 – Cache client hit test values
Around this time, a few more people started to get involved in Australis performance work. Gijs and mstange got a bug filed to investigate if there was a way to make start-up faster on Windows XP and 7. Here’s some context from mstange in that bug in comment 9:
It turns out that Windows XP sends about 200 WM_NCHITTEST events per second when we open a new window. All these events have the same position – possibly the current mouse position. And all the ClientMarginHitTestPoint optimizations we’ve been playing with only make a difference because that function is called so often during the test – one invocation is unnoticeably quick, but it starts to add up if we call it so many times.
This patch makes sure that we only send one hittest event per second if the position doesn’t change, and returns a cached value otherwise.
After some fiddling about with cache invalidation times, the patch landed, and we saw a nice win on Windows XP and 7!
Bug 906075 – Only send toolbars through buildArea if they’re not in their default state
It was around now that I started to get involved with performance work. One of my first successful bugs was to only run a toolbar through CustomizableUI’s buildArea function if the toolbar was not starting in a default state. The buildArea function’s job is to populate a customizable area with only the things that the user has moved into the area, and remove the things that the user has taken out. That involves cycling through the nodes in the area to see if they belong, and that takes time. I wrote a patch that cached a “dirty” state on a toolbar to indicate that it’d been customized in the past, and if we didn’t see that value, we didn’t run the toolbar through the function. Easy as pie, and we saw a little win on both ts_paint and tpaint on all platforms.
Bug 905695 – Skip checking for tab overflows if there is only one tab open
This was another case where we had an unnecessary reflow during start-up. And, like bug 891104, it involved an overflow event handler running when it really didn’t need to. jaws writes:
If only one tab is opened and we show the left/right arrows, we are actually removing quite a bit of space that could have been used to show the tab. Scrolling the tabbox in this state is also quite useless, since all the user can do is scroll to see the other parts of the *only* tab.
If we make this change, we can skip a synchronous reflow for new windows that only have one tab.
Which means we could skip a reflow for all new windows. Are you starting to notice a pattern? Sections of our code had been designed to operate the same way, regardless of whether or not it was in the default, common case. We were finding ways of detecting the default case, and fast-pathing them.
Chalk up another win!
Bug 907787 – Australis: toolbar overflow button should be hidden by default
Yet another example where we could fast-path the default case. The overflow button in the nav-bar is only supposed to be displayed if there are too many items in the nav-bar, resulting in some getting put into the overflow panel, which anchors on the overflow button.
If nothing is being overflowed and the panel is empty, the button should not be displayed.
We were, however, displaying the button by default, and then hiding it when we determined that nothing was overflowed. Bug 907787 inverted that logic, and hid the button by default, and only showed it when things got overflowed (which was not the default case).
We were getting really close to performance parity with mozilla-central…
Bug 908326 – default the navbar to overflowable to avoid needless reflowing
Once again, an example of us not greasing the default-path. Our overflowable toolbar code applies an overflowable attribute to the nav-bar in order to apply some CSS styles to give the toolbar its overflowing properties. Adding that attribute dynamically means a reflow.
Instead, we just added the attribute to the node’s definition in browser.xul, and dropped that unnecessary reflow like a hot brick.
So how far had we come?
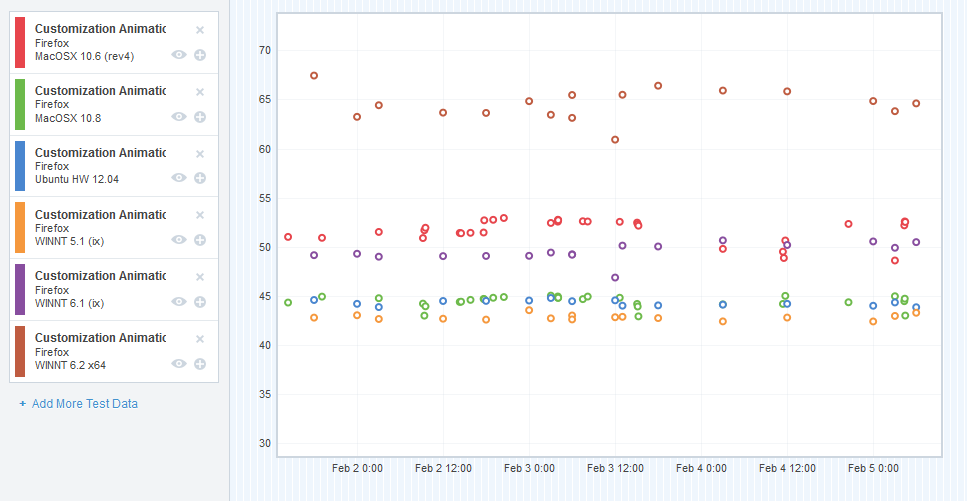
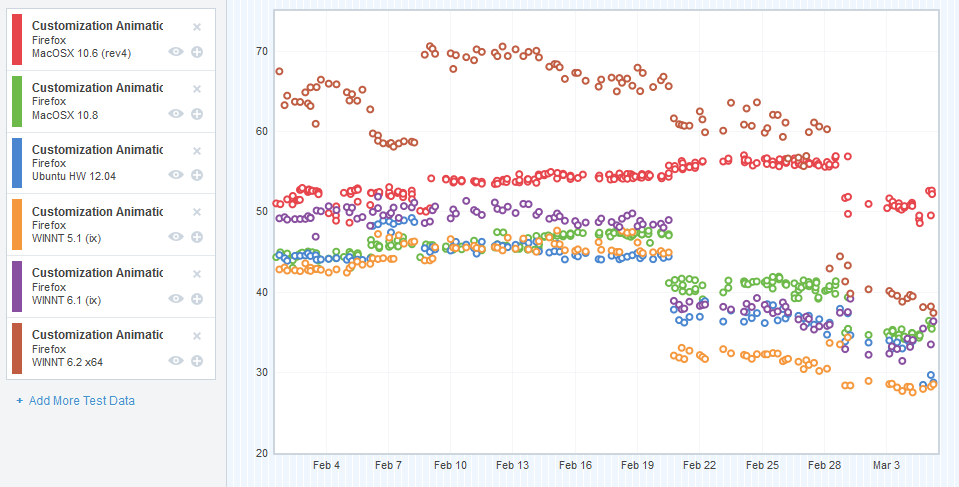
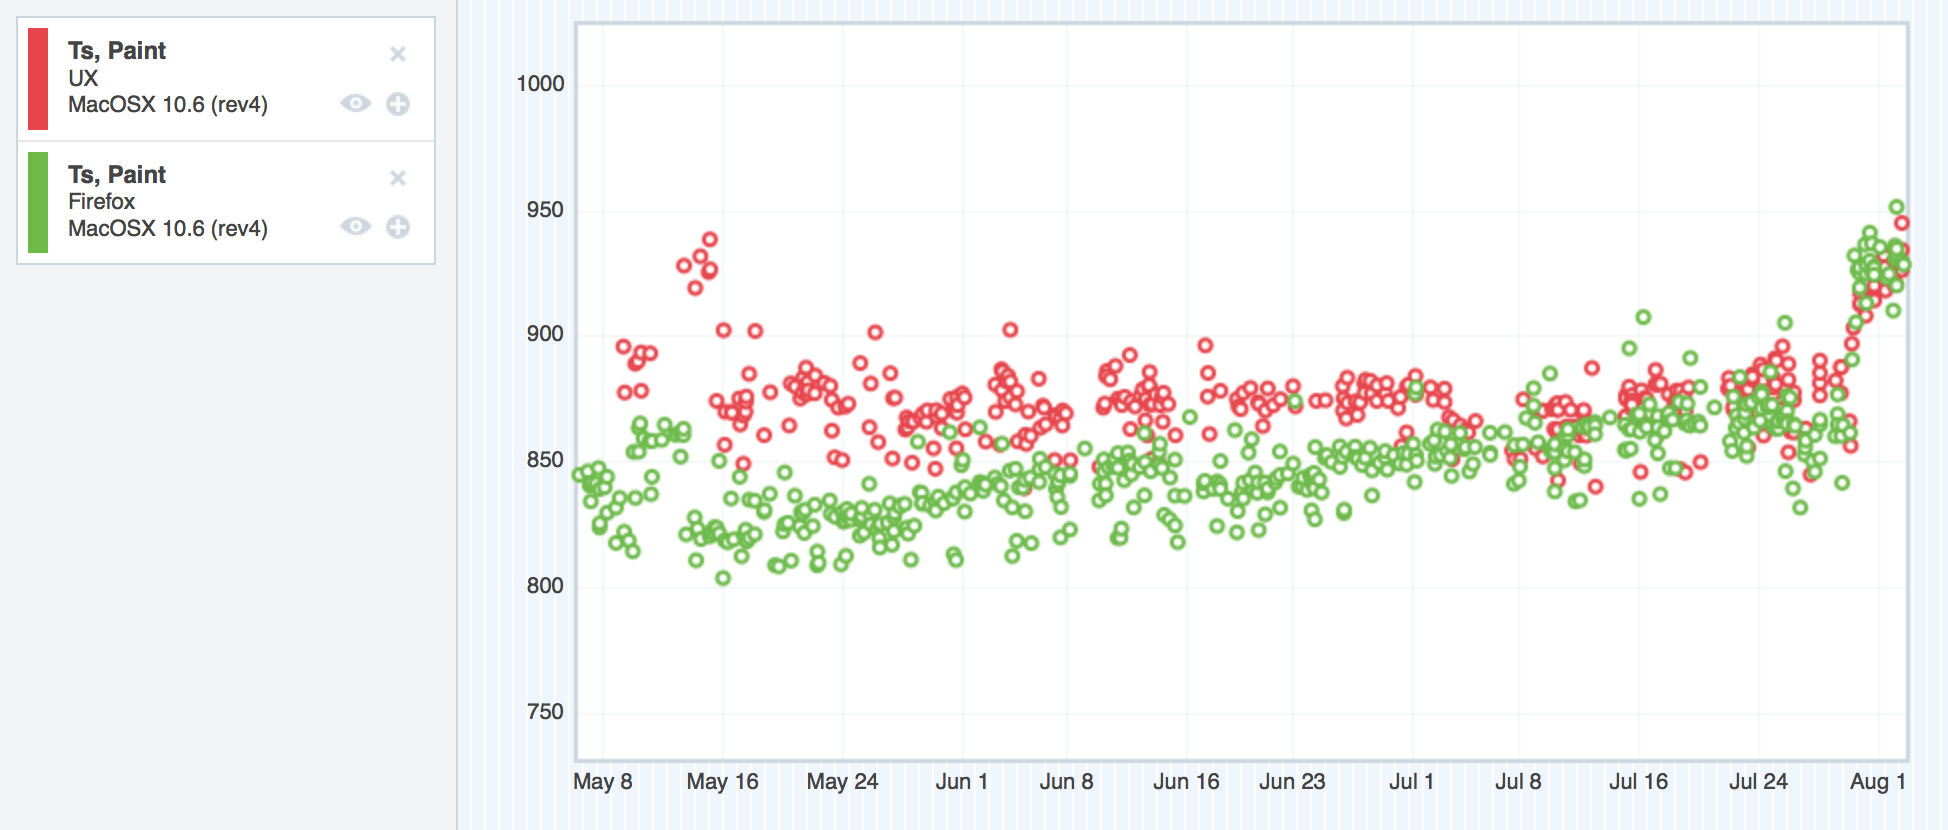
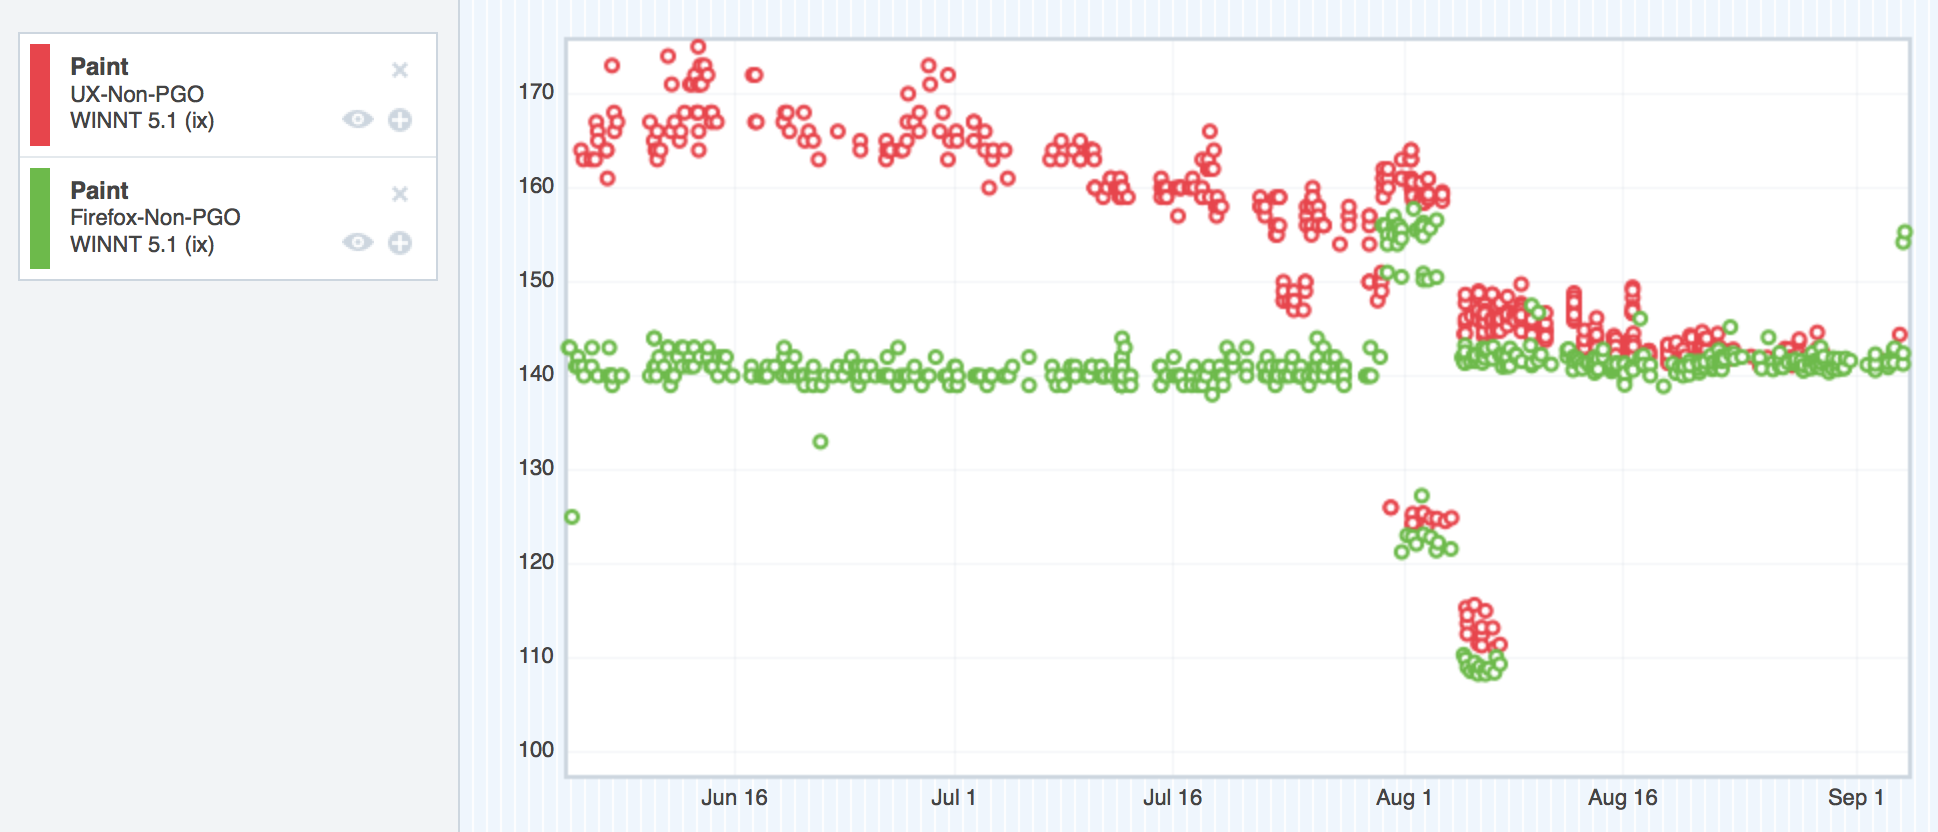
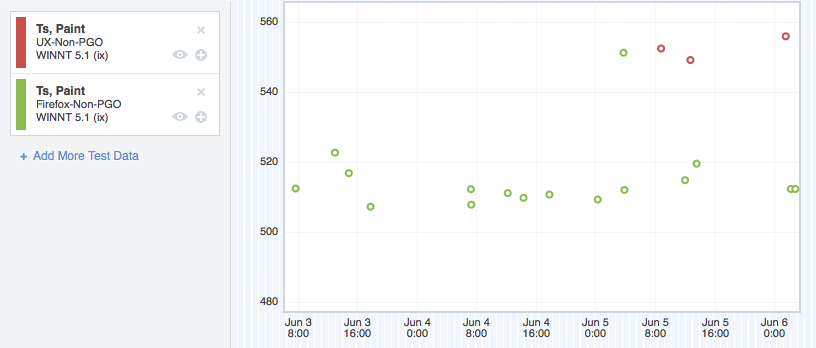
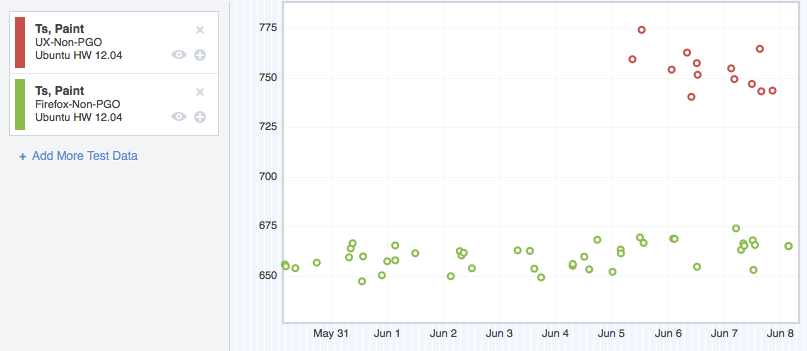
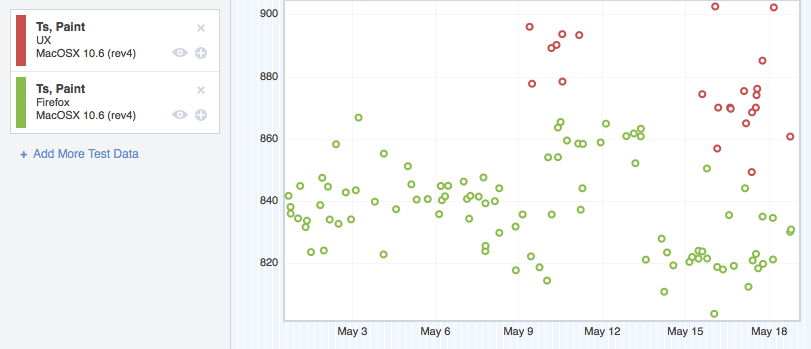
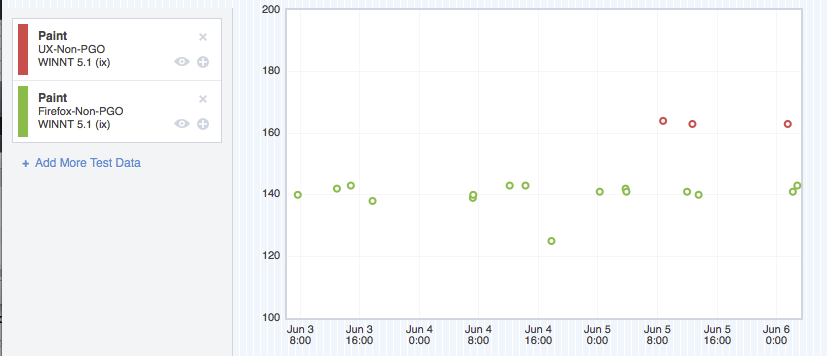
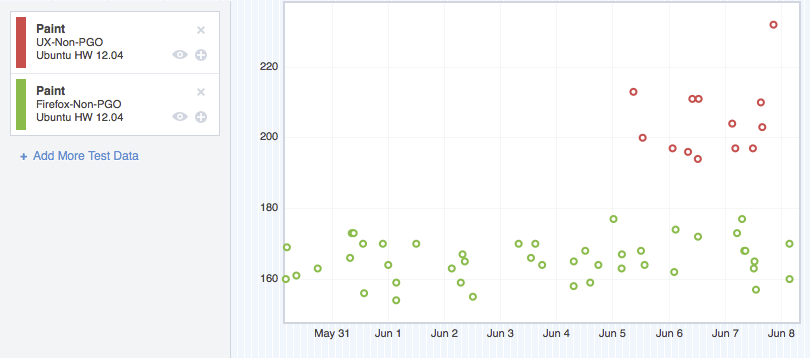
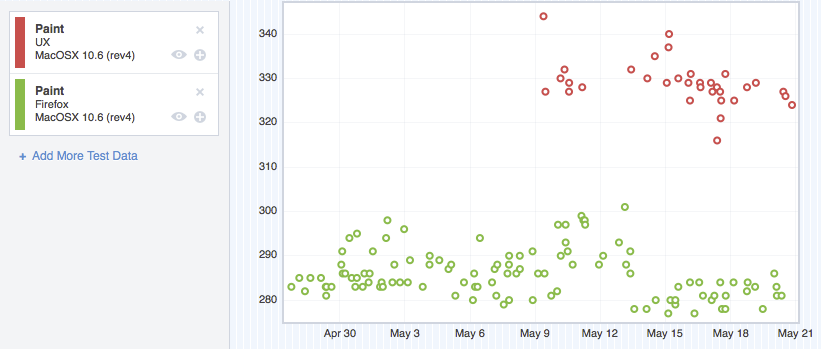
Let’s take a look at the graphs, shall we? Remember, in these graphs, the red points represent UX, and the green represent mozilla-central. Up is bad, and down is good. Our goal was to sink the red dots down into the noise of the green dots, which would give us performance parity.
ts_paint
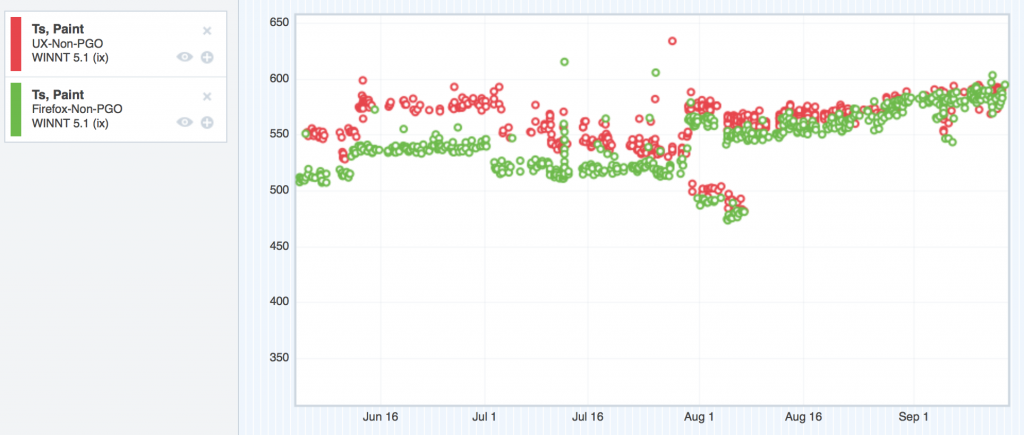
Windows XP – ts_paint improvements

Ubuntu – ts_paint improvements
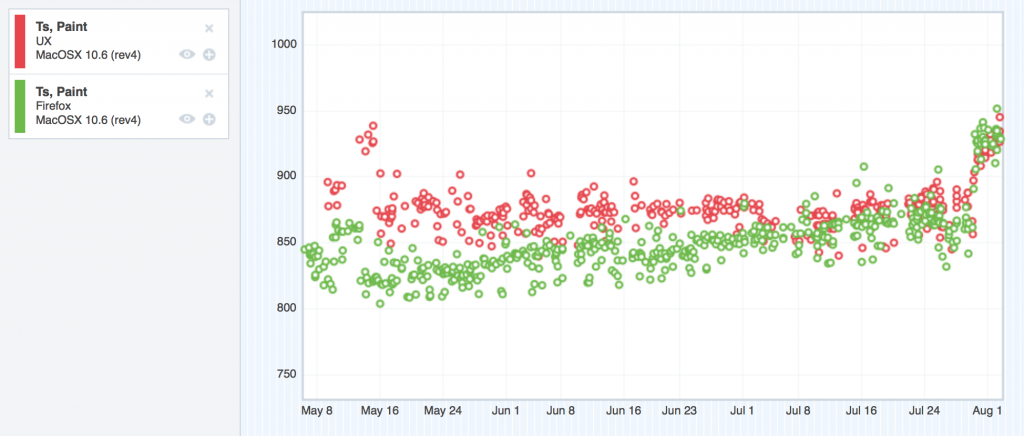
OSX 10.6 ts_paint improvements
You might be wondering what that bug jump is for ts_paint for OSX 10.6 at the end of the graph. This thread explains.
tpaint
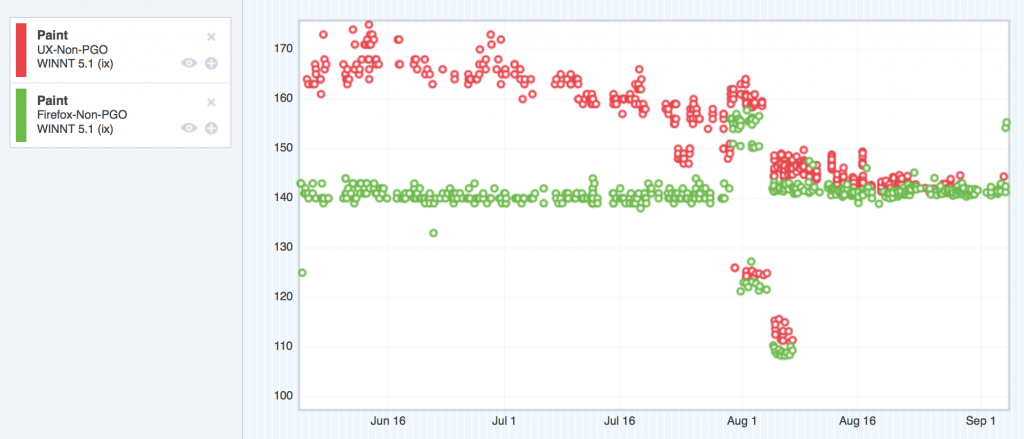
Windows XP – tpaint improvements
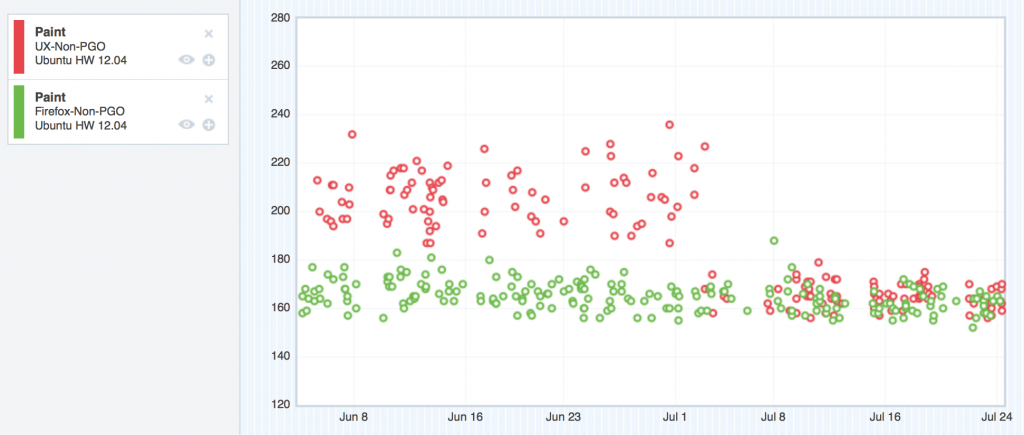
Ubuntu – tpaint improvements
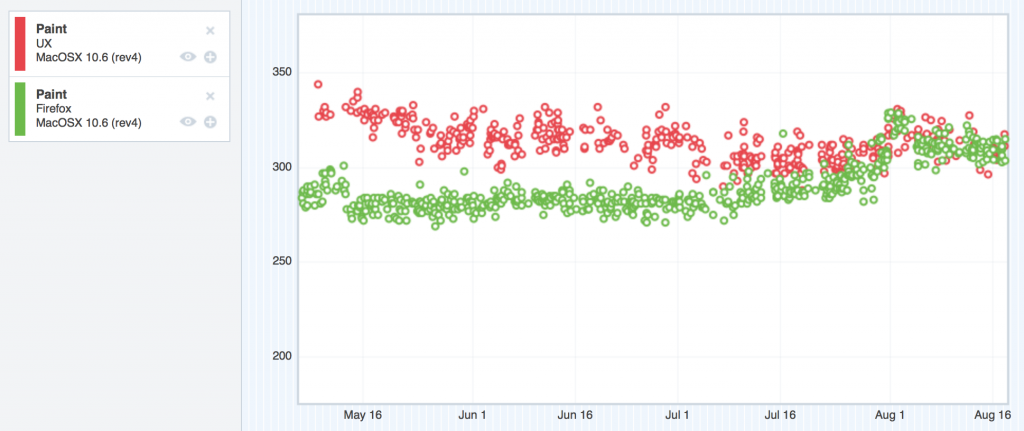
OSX 10.6 tpaint improvements
Looking good.
The big lessons
I think the big lesson here is to identify the common, default case, and optimize it as best you can. By definition, this is the path that’s going to be hit the most, so you can special-case it, and build in fast paths for it. Your users will thank you.
Close the feedback loop as much as you can. To test our theories, we’d push our patches to try and use compare-talos to compare our tpaint and ts_paint numbers to baseline pushes to see if we were making improvements. This requires several hours for the try builds to complete. This is super slow. Release Engineering was awesome and lent us some Windows XP talos slaves for us to experiment on, and that helped us close the feedback loop a lot. Don’t be afraid to ask Release Engineering for talos slaves.
Also note that while it’s easy for me to rattle off bug numbers and explain where we were being slow, all of that investigation and progress occurred over several months. Performance work can be really slow. The bottleneck is not making the slow code faster – the bottleneck is identifying where the slow code is. Profiling is the key here. If you’re not using some kind of profiler while doing performance work, you’re seriously impeding yourself. If you don’t have a profiler, build a simple one. If you don’t know how to build a simple one, find someone who can.
I mentioned Gecko’s built-in SPS profiler a few paragraphs back. The SPS profiler was instrumental (pun intended) in getting our performance back up to snuff. We also built a number of tools alongside the SPS profiler to help us in our analyses.
Read up about those tools we built in Part 3…