Whoops, forgot that I had a blog post series going on here where I talk about the stuff we did to make Australis blazing fast. In that time, we’ve shipped the thing (Firefox 29 represent!), so folks are actually feeling the results of this performance work, which is pretty excellent.
I ended the last post on an ominous note – something about how we were clear to land Australis on Nightly, or so we thought.
This next bit is all about timing.
There is a Performance Team at Mozilla, who are charged with making our products crazy-fast and crazy-smooth. These folks are geniuses at wringing out every last millisecond possible from a computation. It’s what they do all day long.
A pretty basic principle that I’ve learned over the years is that if you want to change something, you first have to develop a system for measuring the thing you’re trying to change. That way, you can determine if what you’re doing is actually changing things in the way you want them to.
If you’ve been reading this Australis Performance Post-mortem posts, you’ll know that we have some performance tests like this, and they’re called Talos tests.
Just about as we were finishing off the last of the t_paint and ts_paint regressions, the front-end team was suddenly made aware of a new Talos test that was being developed by the Performance team. This test was called TART, and stands for Tab Animation Regression Test. The purpose of this test is to exercise various tab animation scenarios and measure the time it takes to paint each frame and to proceed through the entire animation of a tab open and a tab close.
The good news was that this new test was almost ready for running on our Nightly builds!
The bad news was that the UX branch, which Australis was still on at the time, was regressing this test. And since we cannot land if we regress performance like this… it meant we couldn’t land.
Bad news indeed.
Or was it? At the time, the lot of us front-end engineers were groaning because we’d just slogged through a ton of other performance regressions. Investigating and fixing performance regressions is exhausting work, and we weren’t too jazzed that another regression had just shown up.
But thinking back, I’m somewhat glad this happened. The test showed that Australis was regressing tab animation performance, and tabs are opened every day by almost every Firefox user. Regressing tab performance is simply not a thing one does lightly. And this test caught us before we landed something that regressed those tabs mightily!
That was a good thing. We wouldn’t have known otherwise until people started complaining that their tabs were feeling sluggish when we released it (since most of us run pretty beefy development machines).
And so began the long process of investigating and fixing the TART regressions.
So how bad were things?
Let’s take a look at the UX branch in comparison with mozilla-central at the time that we heard about the TART regressions.
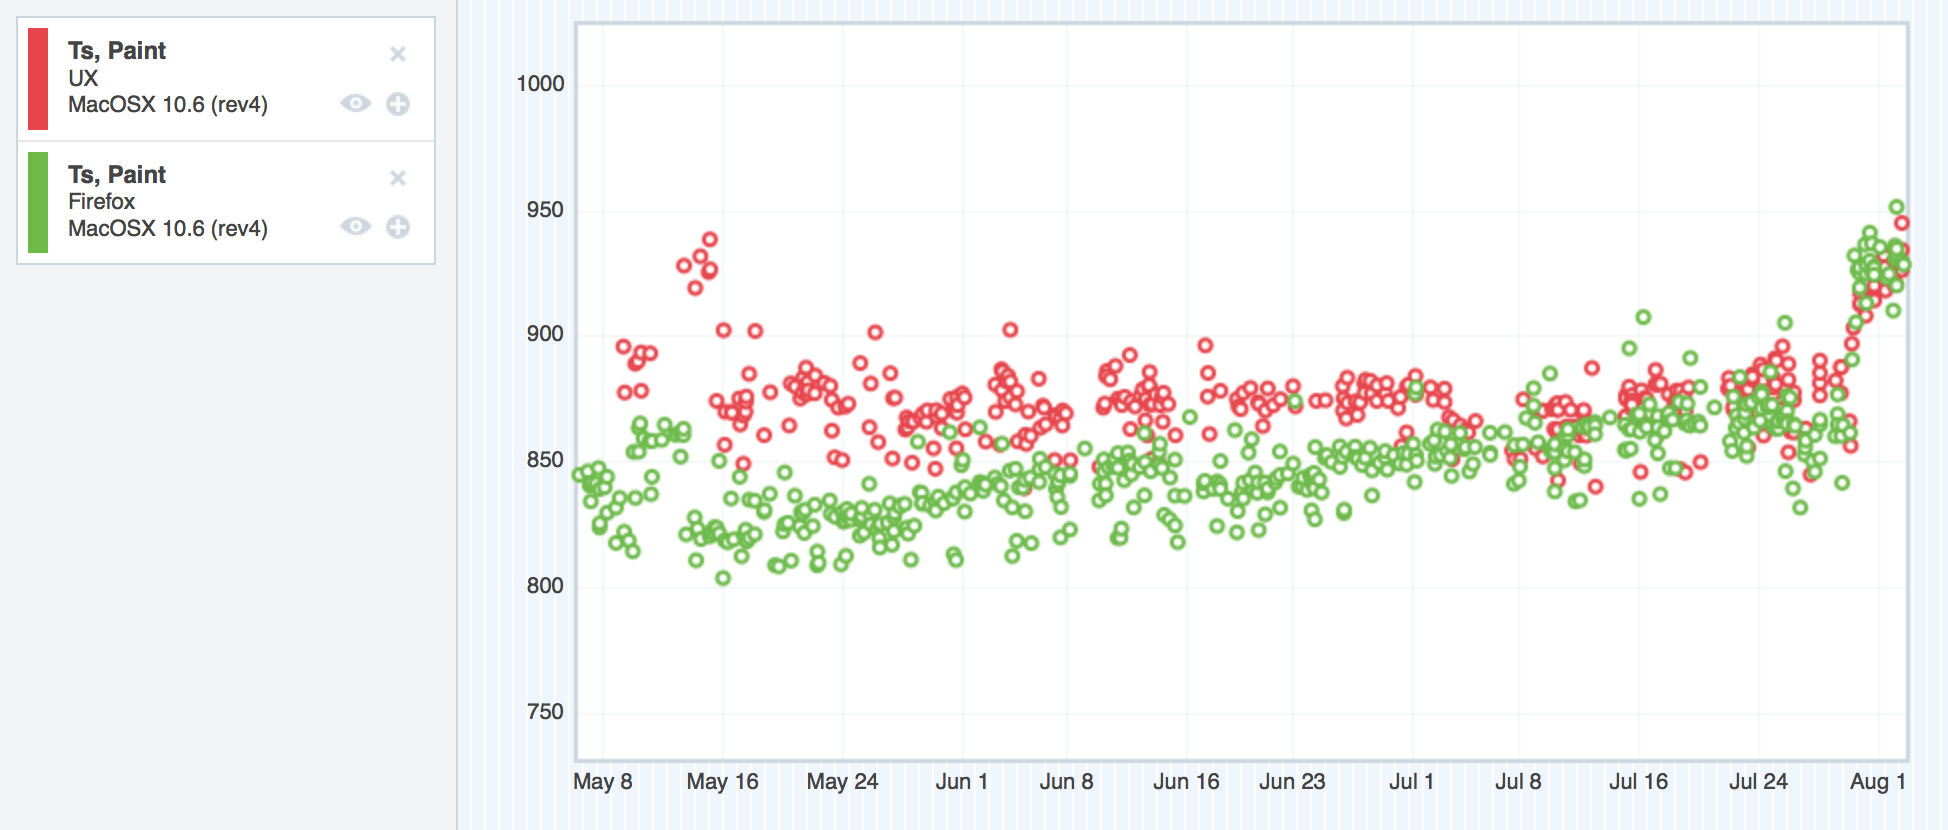
Here are the regressing platforms. I’ll start with Windows XP:

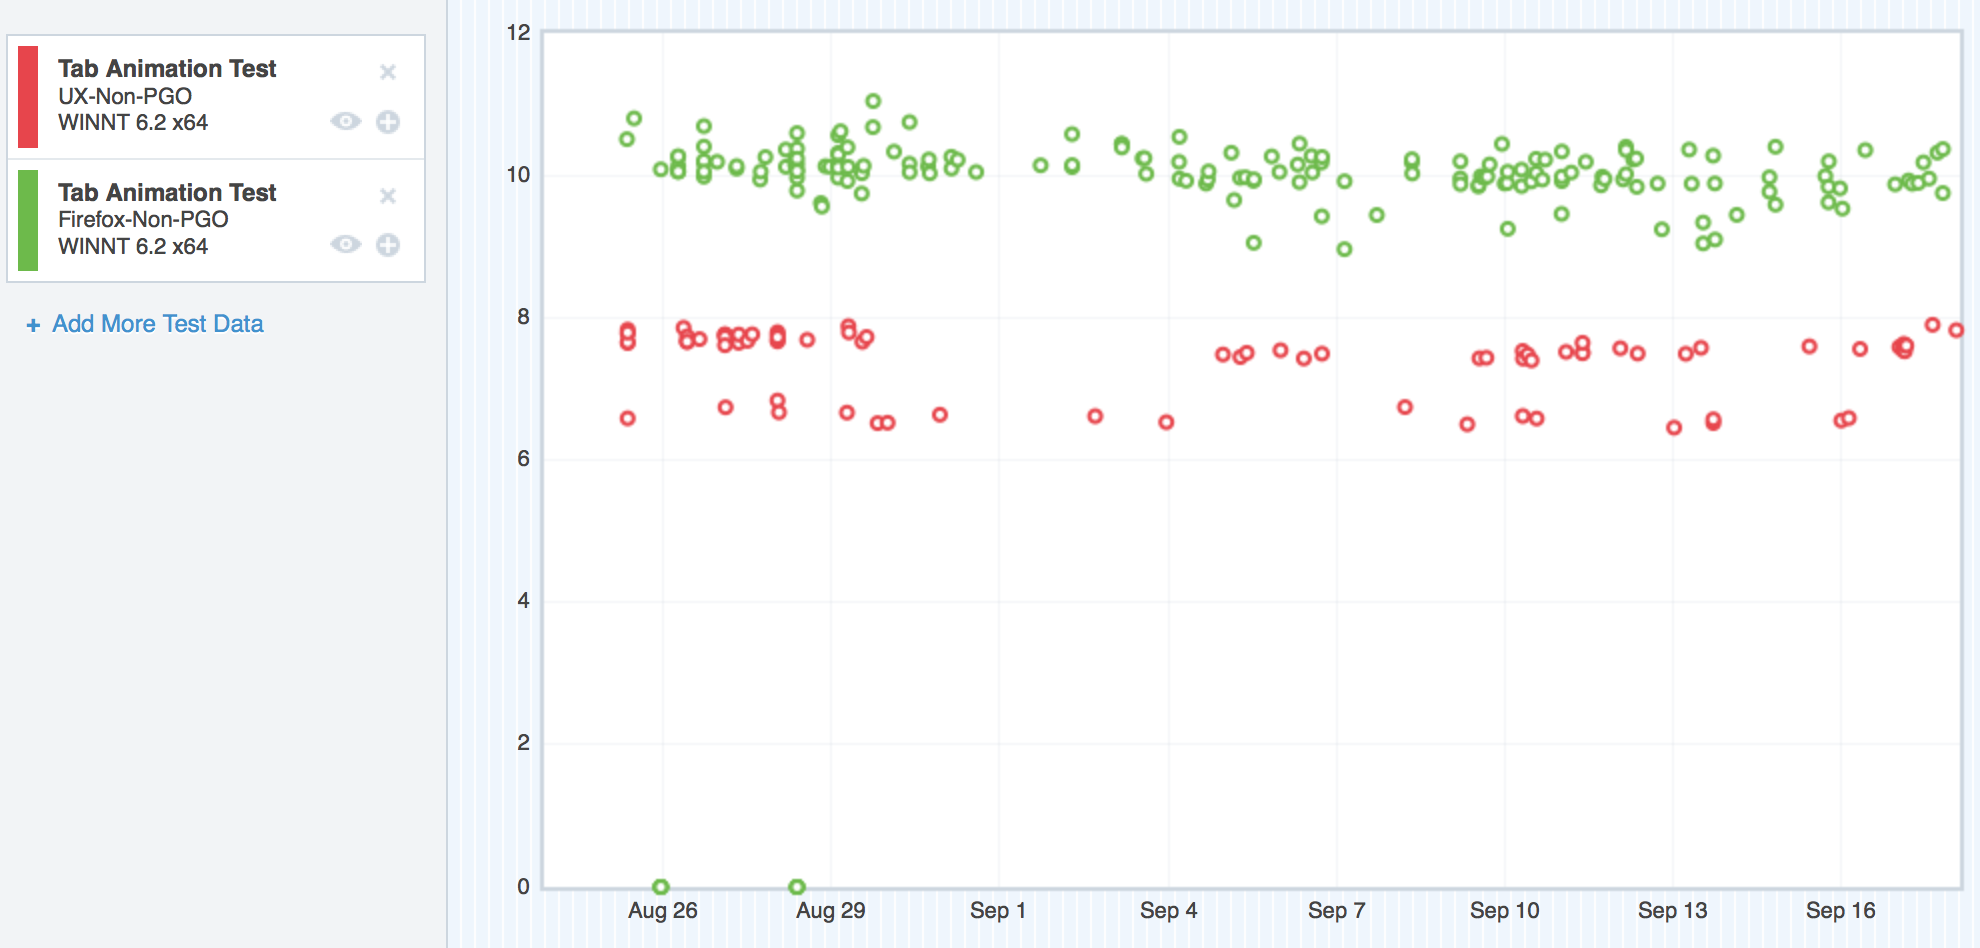
Where we started with TART on Windows XP
Forgive me, I couldn’t get the Graph Server to swap the colours of these two datasets, so my original silent pattern of “red is the regressor” has to be dropped. I could probably spend some time trying to swap the colours through various tricky methods, but I honestly don’t think anybody reading this will care too much.
So here we can see the TART scores for Windows XP, and the UX branch (green) is floating steadily over mozilla-central (red). Higher scores are bad. So here’s the regression.
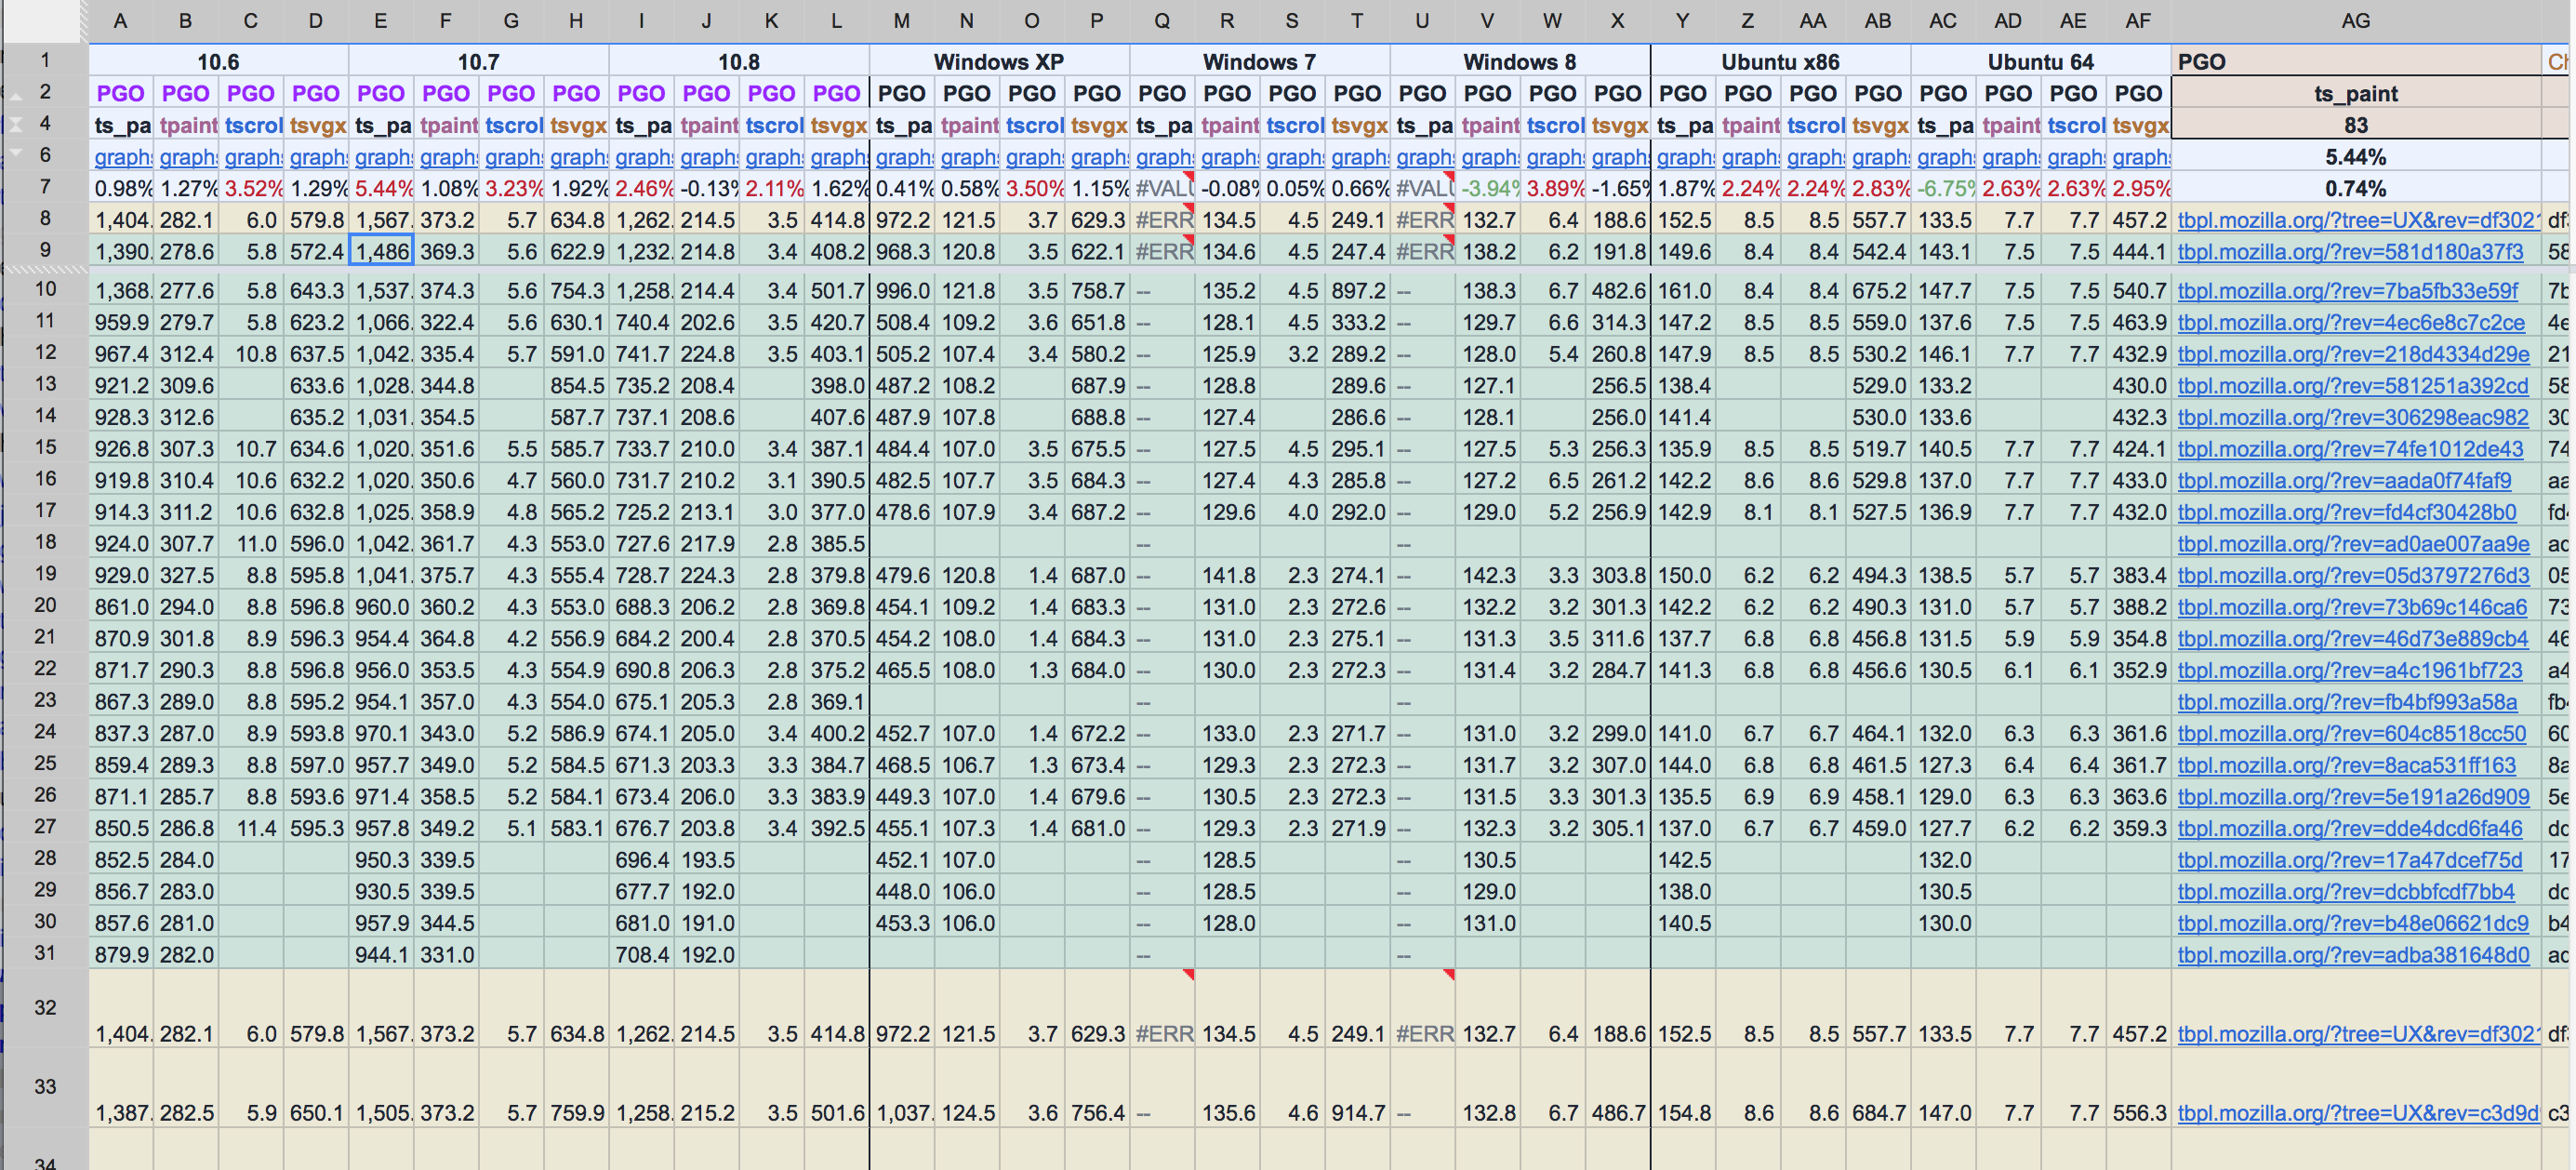
Now let’s see OS X 10.6.
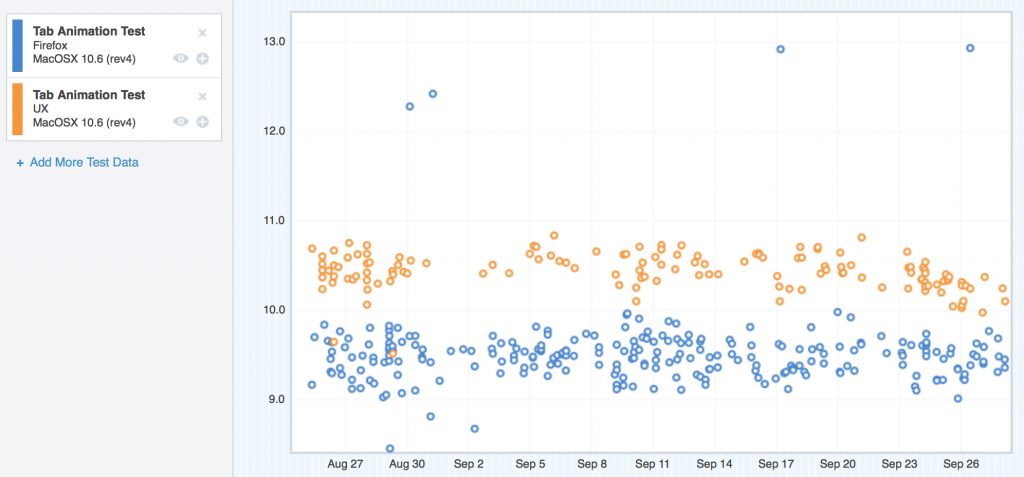
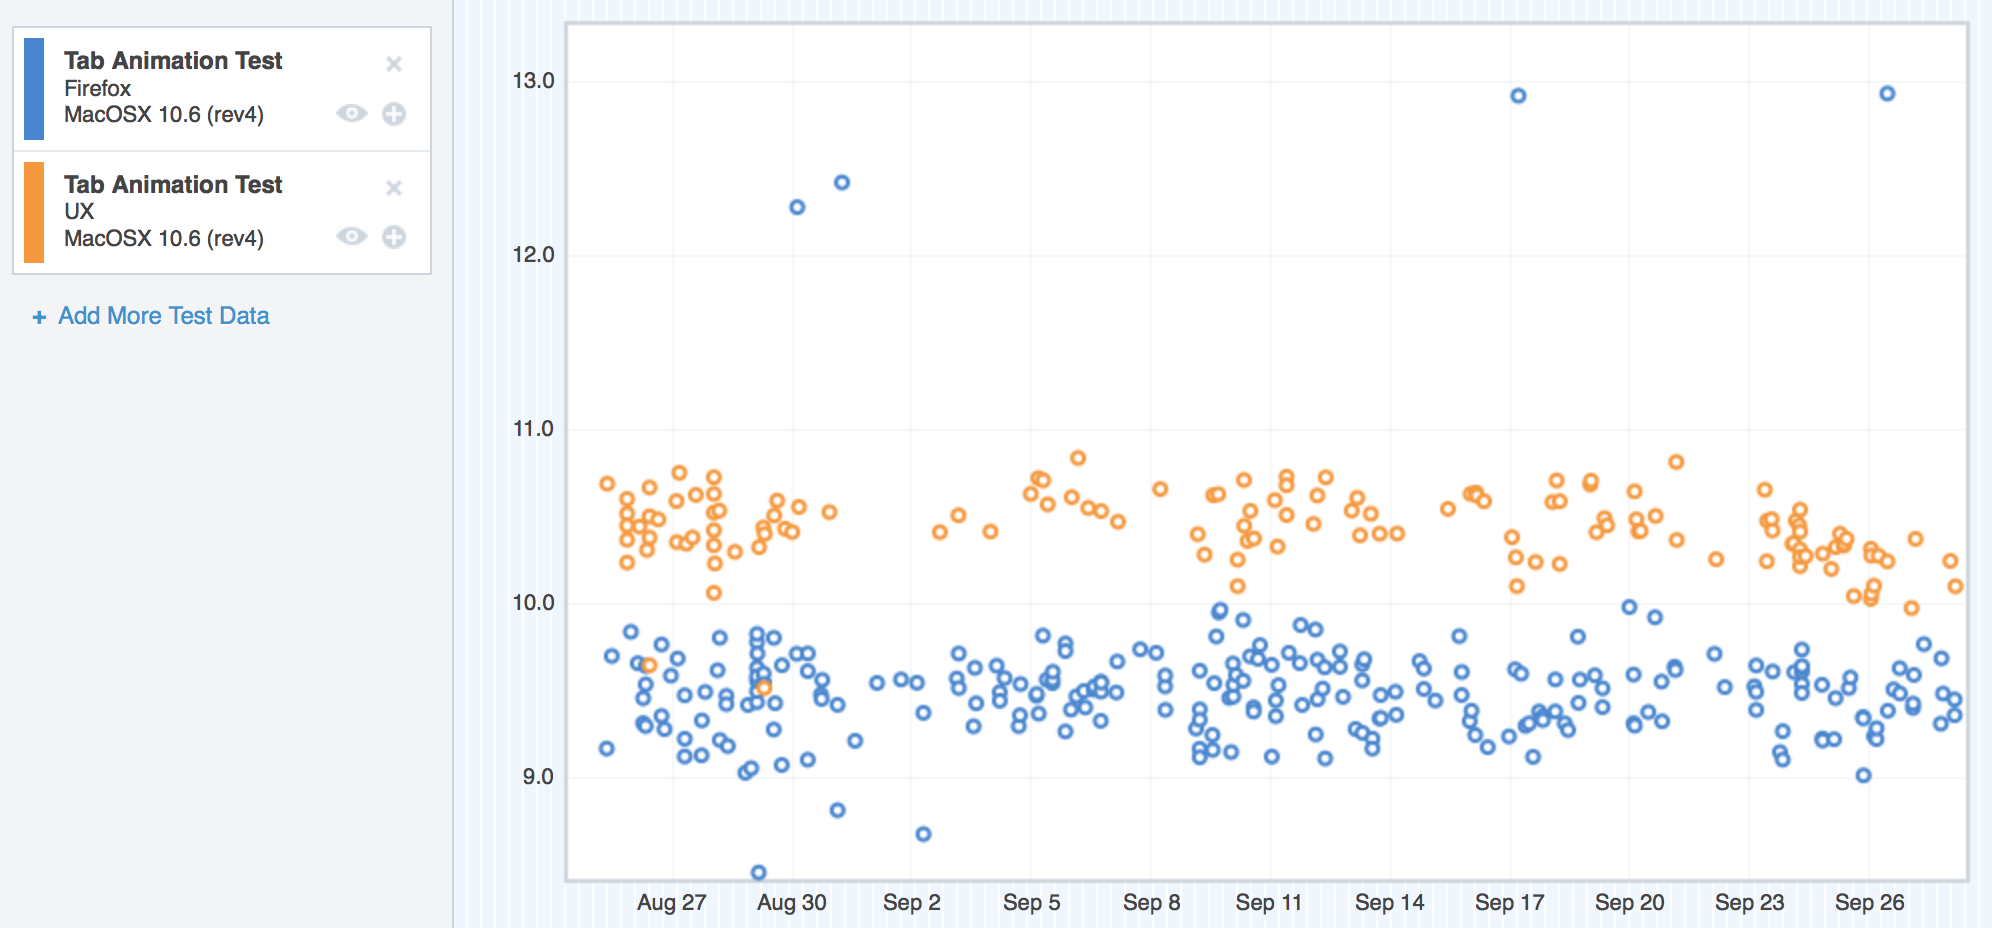
Where we started with TART on OS X 10.6
Same problem here – the UX nodes (tan) are clearly riding higher than mozilla-central. This was pretty similar to OS X 10.7 too, so I didn’t include the graph.
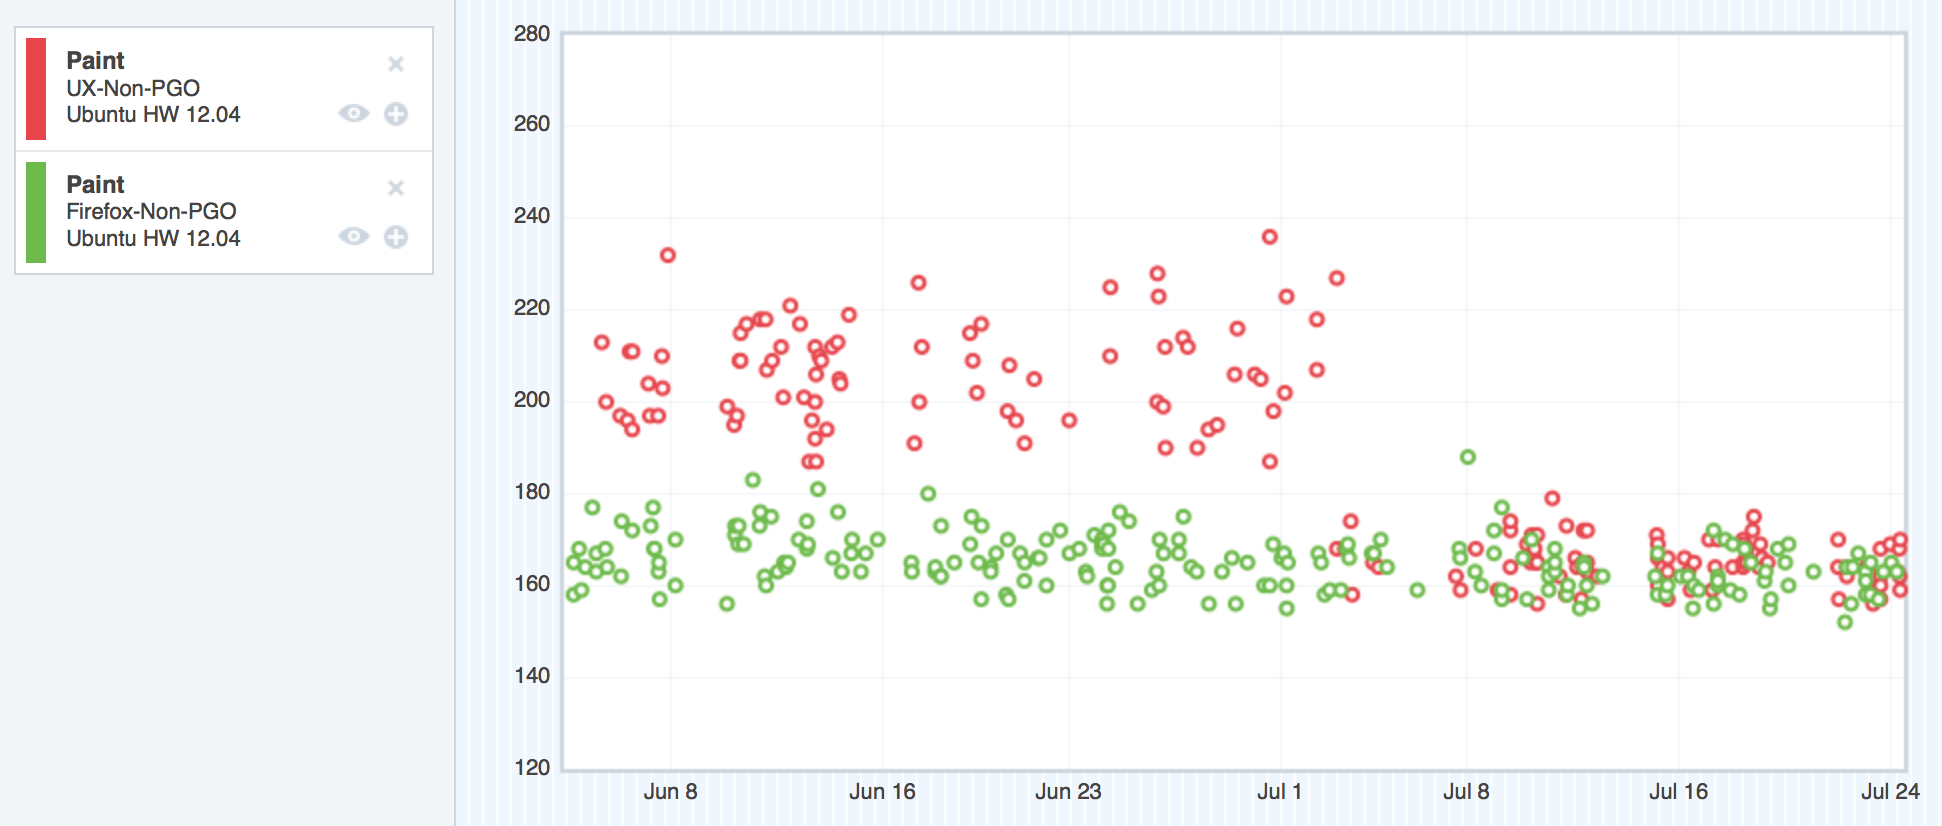
On OS X 10.8, things were a little bit better, but not too much:
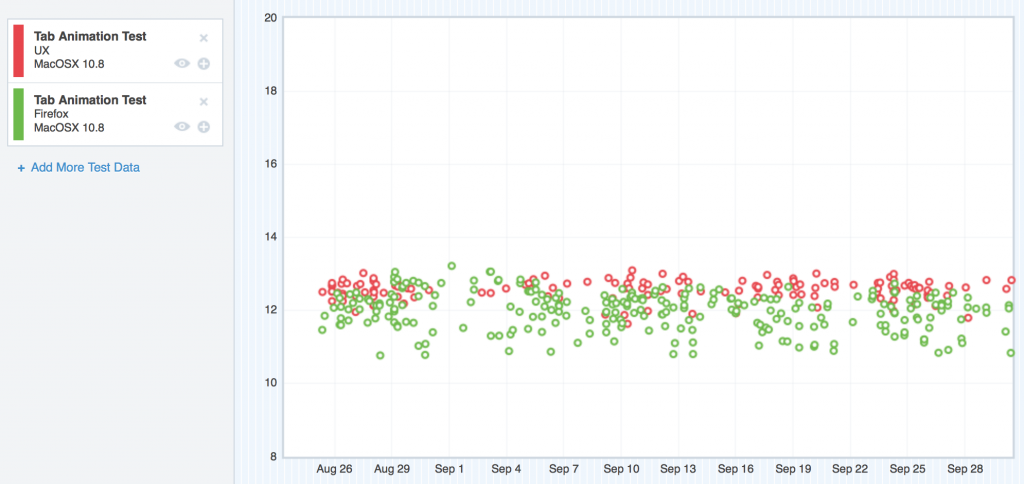
Where we started with TART on OS X 10.8
Here, the regression was still easily visible, but not as large in magnitude.
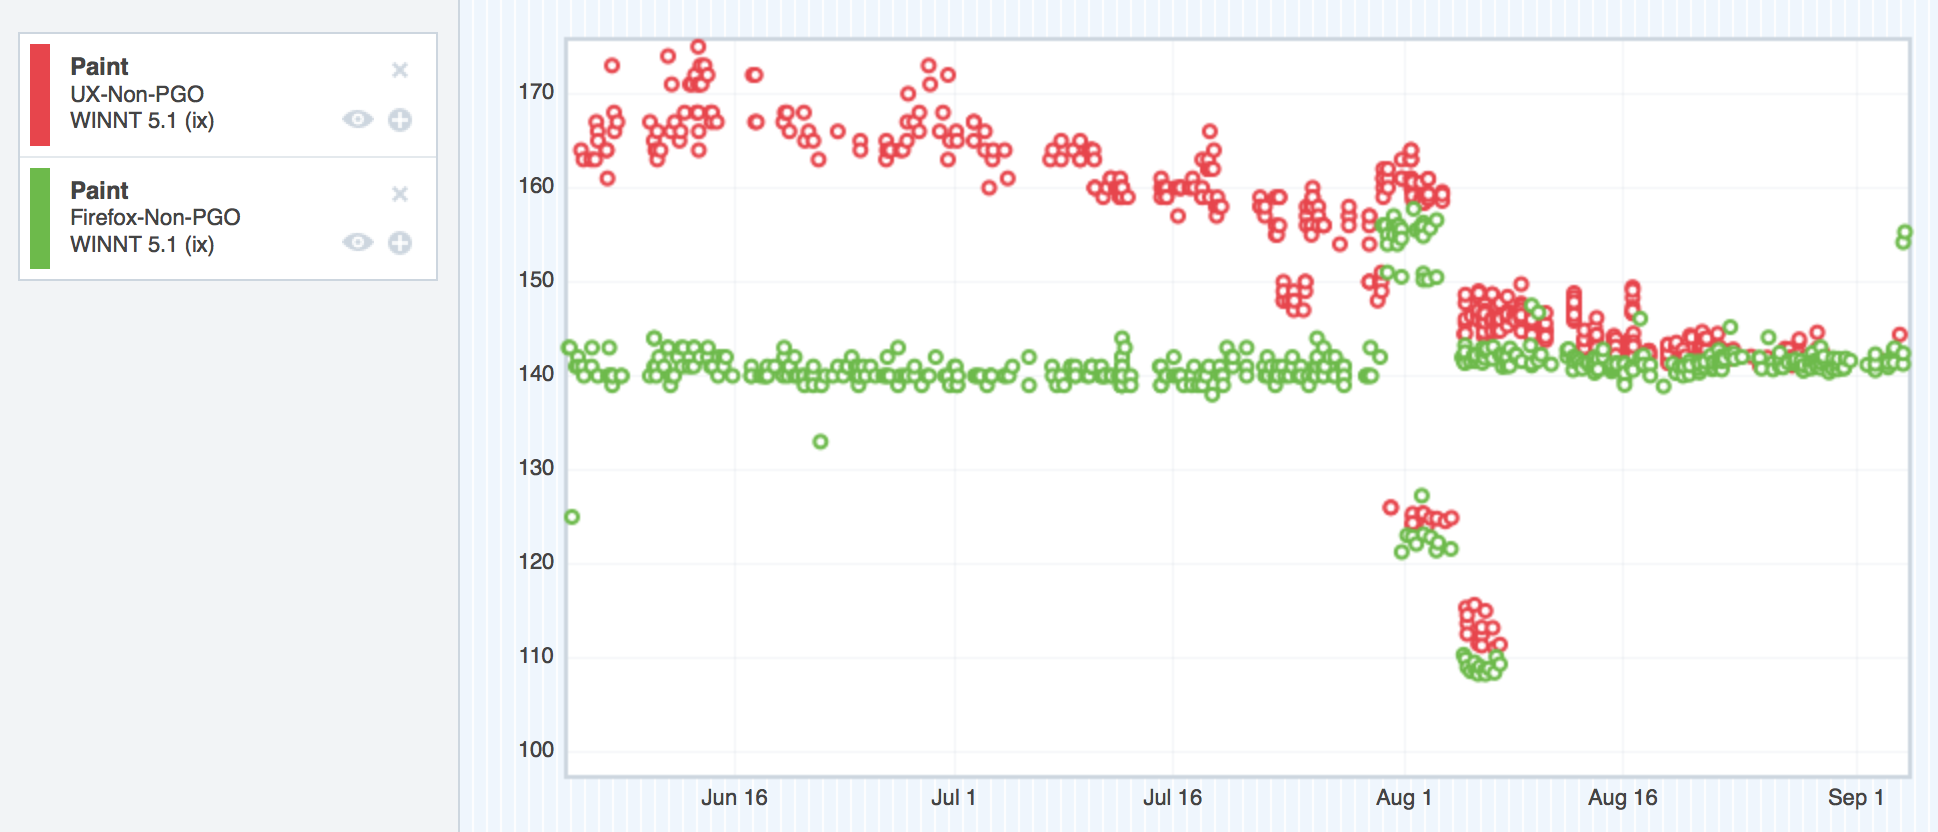
Ubuntu was in the same boat as OS X 10.6/10.7 and Windows XP:
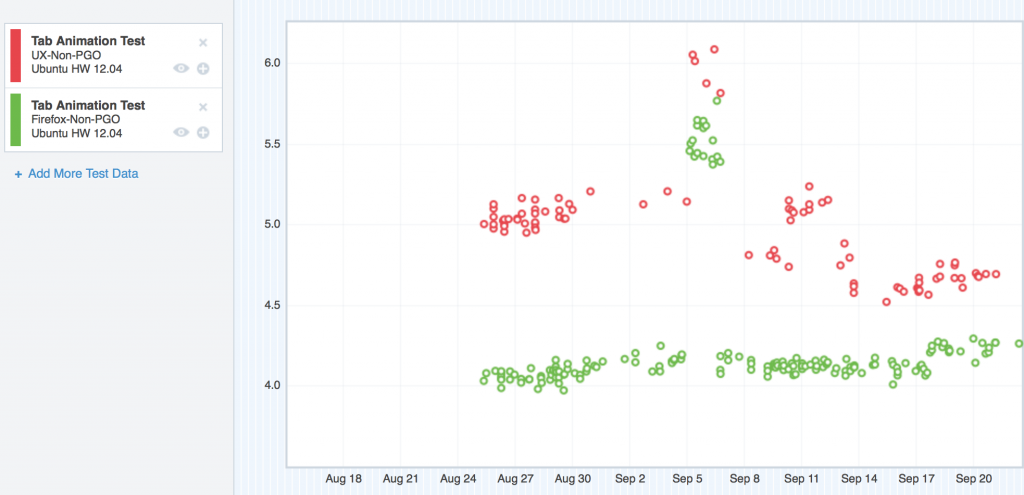
Where we started with TART on Ubuntu
But what about Windows 7 and Windows 8? Well, interesting story – believe it or not, on those platforms, UX seemed to perform better than mozilla-central:
Windows 7 (the blue nodes are mozilla-central, the tan nodes are UX)
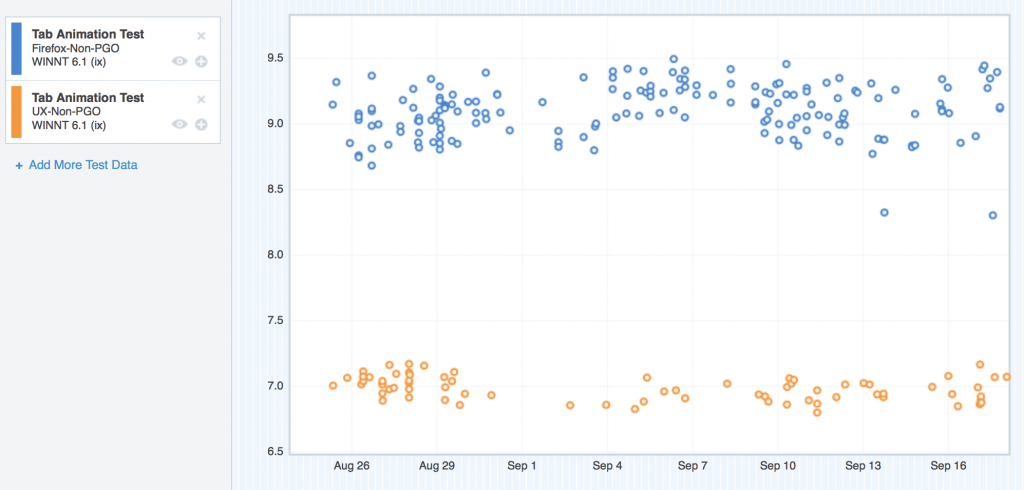
Where we started with TART on Windows 7
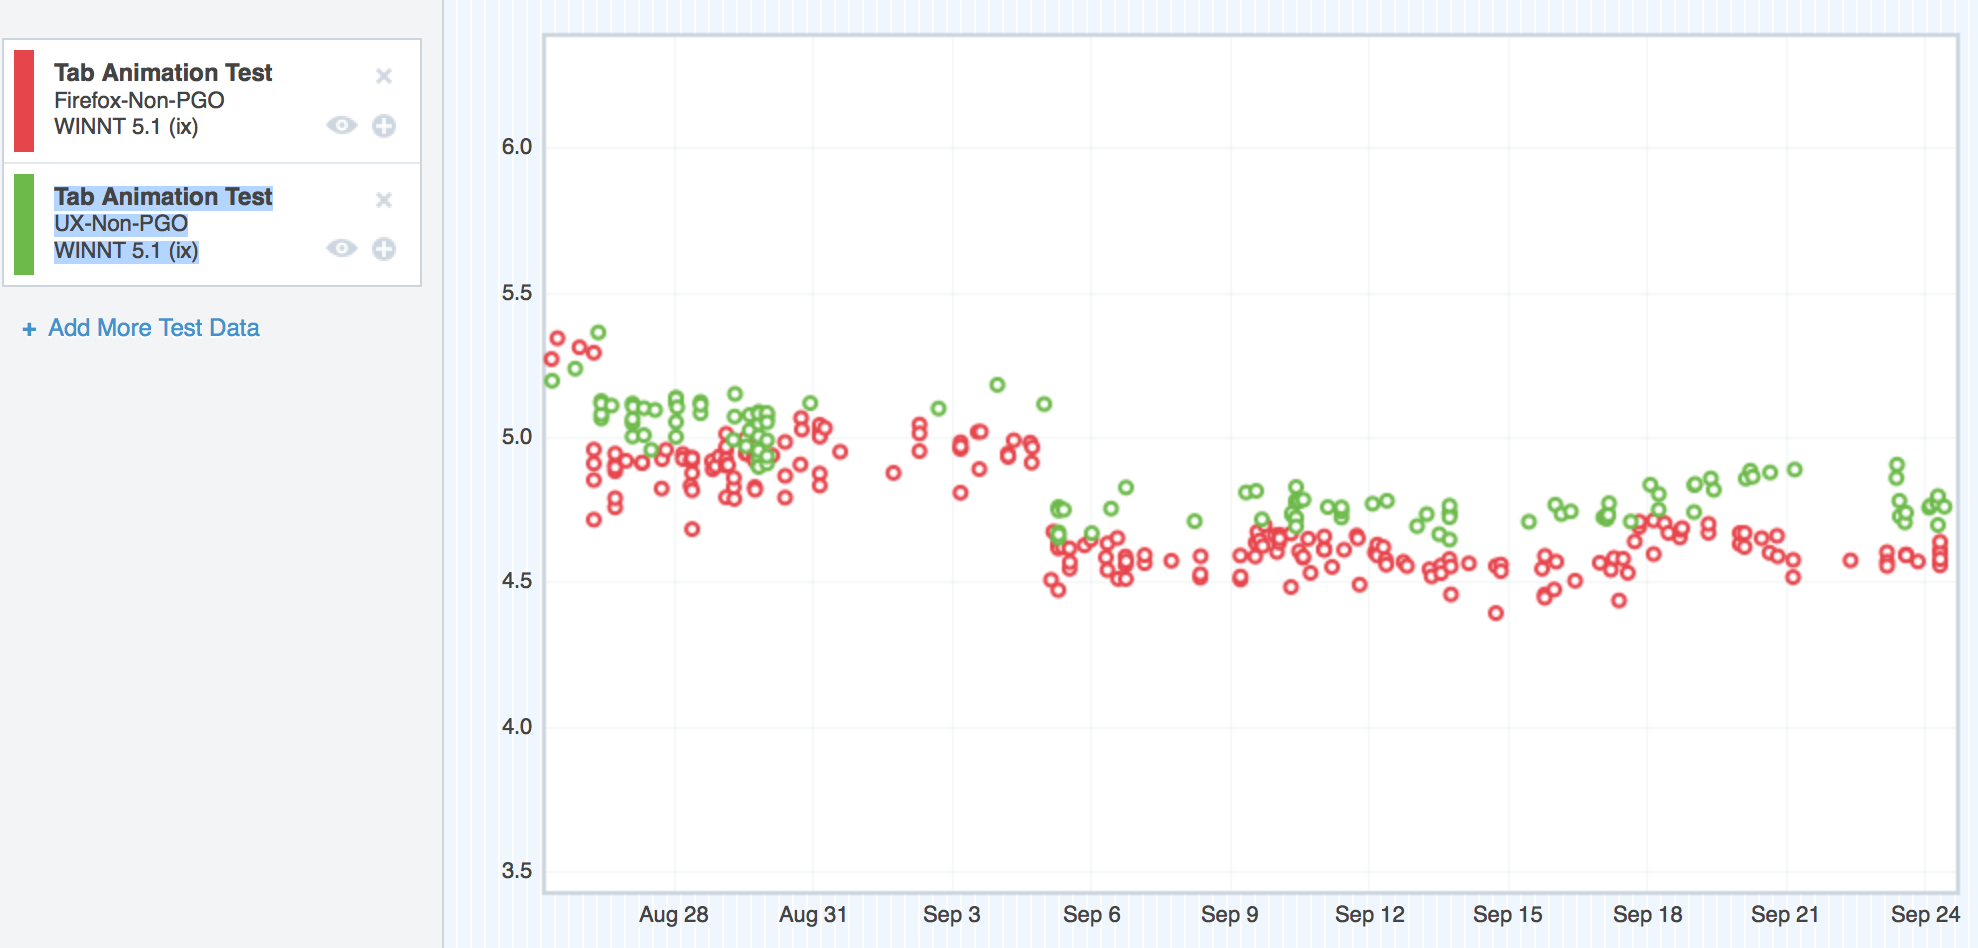
Windows 8 (the green nodes are mozilla-central, the red nodes are UX)

Where we started with TART on Windows 8
So what the hell was going on?
Well, we eventually figured it out. I’ll lay it out in the next few paragraphs. The following is my “rogue’s gallery” of regressions. This list does not include many false starts and red herrings that we followed during the months working on these regressions. Think of this as “getting to the good parts”.
Backfilling
The problem with having a new test, and having mozilla-central better than UX, is not knowing where UX got worse; there was no historical measurements that we could look at to see where the regression got introduced.
MattN, smart guy that he is, got us a few talos loaner machines, and wrote some scripts to download the Nightlies for both mozilla-central and UX going back to the point where UX split off. Then, he was able to run TART on these builds, and supply the results to his own custom graph server.
So basically, we were able to backfill our missing TART data, and that helped us find a few points of regression.
With that data, now it was time to focus in on each platform, and figure out what we could do with it.
Windows XP
We started with XP, since on the regressing platforms, that’s where most of our users are.
Here’s what we found and fixed:
Bug 916946 – Stop animating the back-button when enabling or disabling it.
During some of the TART tests, we start with single tab, open a new tab, and then close the new tab, and repeat. That first tab has some history, so the back button is enabled. The new tab has no history, so the back button is disabled.
Apparently, we had some CSS that was causing us to animate the back-button when we were flipping back and forth from the enabled / disabled states. That CSS got introduced in the patch that bound the back/forward/stop/reload buttons to the URL bar. It seemed to affect Windows only. Fixing that CSS gave us our first big win on Windows XP, and gave us more of a lead with Windows 7 and Windows 8!
Bug 907544 – Pass the D3DSurface9 down into Cairo so that it can release the DC and LockRect to get at the bits
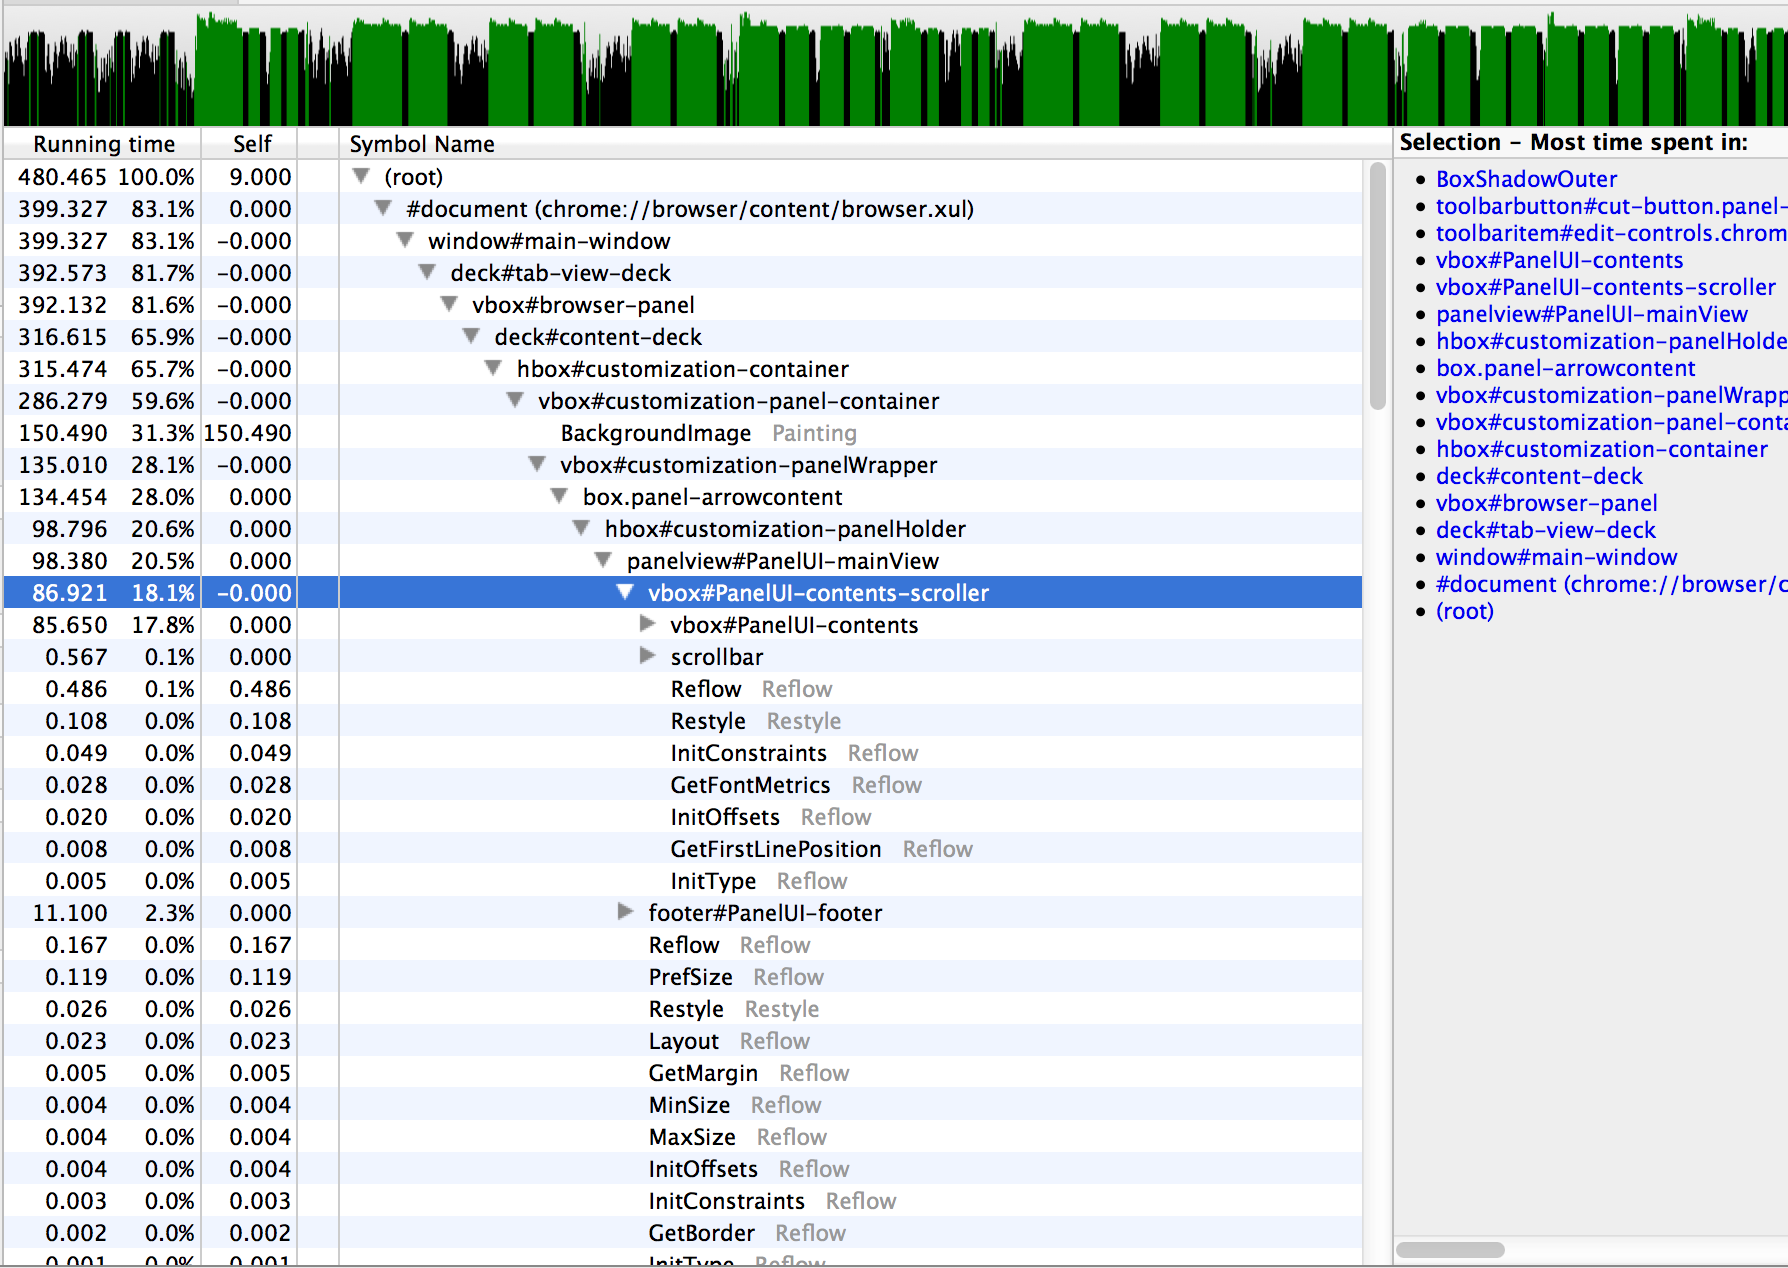
I don’t really remember how this one went down (and I don’t want to really spend the time swapping it back in by reading the bug), but from my notes it looks like the Graphics team identified this possible performance bottleneck when I showed them some profiles I gathered when running TART.
The good news on this one, was that it definitely gave the UX branch a win on Windows XP. The bad news is that it gave the same win to mozilla-central. This meant that while overall performance got better on Windows XP, we still had the same regression preventing us from landing.
Bug 919541 – Consider not animating the opacity for Australis tabs
Jeff Muizelaar helped me figure this out while we were using paint flashing to analyze paint activity while opening and closing tabs. When we slowed down the transitions, we noticed that the closing tabs were causing paints even though they weren’t visible. Closing tabs aren’t visible because with Australis, we don’t show the tab shape around tabs when they’re not selected – and closing a tab automatically unselects it for something else.
For some reason, our layout and graphics code still wanted to paint this transition even though the element was not visible. We quickly nipped that in the bud, and got ourselves a nice win on tab close measurements for all platforms!
Bug 921038 – Move selected tab curve clip-paths into SVG-as-an-image so it is cached.
This was the final nail in the coffin for the TART regression on Windows XP. Before this bug, we were drawing the linear-gradients in the tab shape using CSS, and the clipping for the curve background colour was being pulled off using clip-path and an SVG curve defined in the browser.xul document.
In this bug, we moved from clipping a background to create the curve, to simply drawing a filled curve using SVG, and putting the linear-gradient for the texture in the “stroke” image (the image that overlays the border on the tab curve).
That by itself was not enough to win back the regression – but thankfully, Seth Fowler had been working on SVG caching, and with that cache backend, our patch here knocked the XP and Ubuntu regressions out! It also took out a chunk from OS X. Things were looking good!
OS X
Bug 924415 – Find out why setting chromemargin to 0,-1,-1,-1 is so expensive for TART on UX branch on OS X.
I don’t think I’ll ever forget this bug.
I had gotten my hands on a Mac Mini that (after some hardware modifications) matched the specs of our 10.6 Talos test machines. That would prove to be super useful, as I was easily able to reproduce the regression that machine, and we could debug and investigate locally, without having to remote in to some loaner device.
With this machine, it didn’t take us long to identify the drawing of the tabs in the titlebar as the main culprit in the OS X regression. But the “why” eluded us for weeks.
It was clear I wasn’t going to be able to solve it on my own, so Jeff Muizelaar from the Graphics team joined in to help me.
We looked at OpenGL profiles, we looked at apitraces, we looked at profiles using the Gecko Profiler, and we looked at profiles from Instruments – the profiler that comes included with XCode.
It seemed like the performance bottleneck was coming from the operating system, but we needed to prove it.
Jeff and I dug and dug. I remember going home one day, feeling pretty deflated by another day of getting nowhere with this bug, when as I was walking into my apartment, I got a phone call.
It was Jeff. He told me he’d found something rather interesting – when the titlebar of the browser overlapped the titlebar of another window, he was able to reproduce the regression. When it did not overlap, the regression went away.
Talos tests open a small window before they open any test browser windows. That little test window stays in the background, and is (from my understanding) a dispatch point for making talos tests occur. That little window has a titlebar, and when we opened new browser windows, the titlebars would overlap.
Jeff suggested I try modifying the TART test to move the browser approximately 22px (the height of a standard OS X titlebar) so that they would no longer overlap. I set that up, triggered a bunch of test runs, and went to bed.
I wasn’t able to sleep. Around 4AM, I got out of bed to look at the results – SUCCESS! The regression had gone away! Jeff was right!
I slept like a baby the rest of the night.
We closed this bug as a WONTFIX due to it being way outside our control.
Comment 31 and onward in that bug are the ones that describe our findings.
Eat it TART, your tears are delicious
Those were the big regressions we fixed for TART. It was a long haul, but we got there – and in the end, it means faster and smoother tab animation for our users, which means a better experience – and it’s totally worth it.
I’m particularly proud of the work we did here, and I’m also really happy with the cross-team support and collaboration we had – from Performance, to Layout, to Graphics, to Front-end – it was textbook teamwork.
Here’s an e-mail I wrote about us beating TART.
Where did we end up?
After the TART regression was fixed, we were set to land on mozilla-central! We didn’t just land a more beautiful browser, we also landed a more performant one.
Noice.
Stay tuned for Part 5 where I talk about CART.


