Tag Archives: performance

Australis Performance Post-mortem Part 3: As Good As Our Tools

While working on the ts_paint and tpaint regressions, we didn’t just stab blindly at the source code. We had some excellent tools to help us along the way. We also MacGyver‘d a few of those tools to do things that they weren’t exactly designed to do out of the box. And in some cases, we built new tools from scratch when the existing ones couldn’t cut it.

I just thought I’d write about those.

MattN’s Spreadsheet

I already talked about this one in my earlier post, but I think it deserves a second mention. MattN has mad spreadsheet skills. Also, it turns out you can script spreadsheets on Google Docs to do some pretty magical things – like pull down a bunch of talos data, and graph it for you.

I think this spreadsheet was amazingly useful in getting a high-level view of all of the performance regressions. It also proved very, very useful in the next set of performance challenges that came along – but more on those later.

MattN’s got a blog post up about his spreadsheet that you should check out.

The Gecko Profiler

This is a must-have for Gecko hackers who are dealing with some kind of performance problem. The next time I hit something performance related, this is the first tool I’m going to reach for. We used a number of tools in this performance work, but I’m pretty sure this was the most powerful one in our arsenal.

Very simply, Gecko ships with a built-in sampling profiler, and there’s an add-on you can install to easily dump, view and share these profiles. That last bit is huge – you click a button, it uploads, and bam – you have a link you can send to someone over IRC to have them look at your profile. It’s sheer gold.

We also built some tools on top of this profiler, which I’ll go into in a few paragraphs.

You can read up on the Gecko Profiler here at the official documentation.

Homebrew Profiler

At one point, jaws built a very simple profiler for the CustomizableUI component, to give us a sense of how many times we were entering and exiting certain functions, and how much time we were spending in them.

Why did we build this? To be honest, it’s been too long and I can’t quite remember. We certainly knew about the Gecko Profiler at this point, so I imagine there was some deficiency with the profiler that we were dealing with.

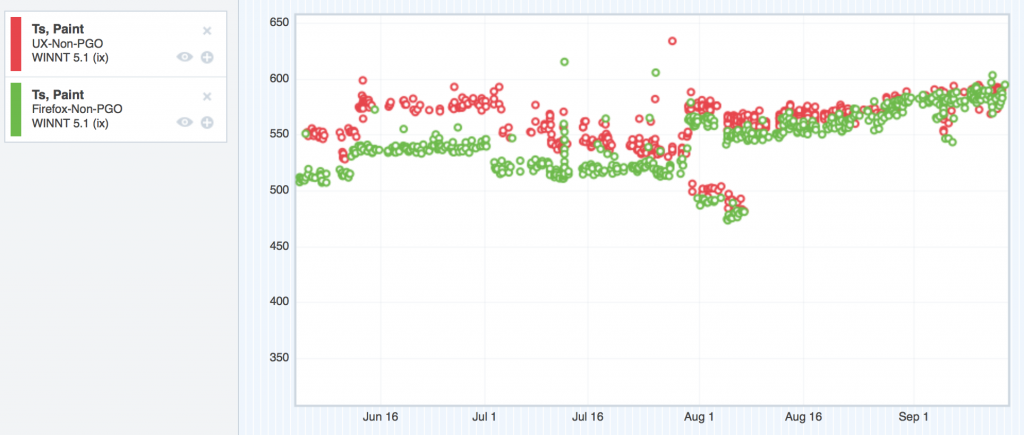
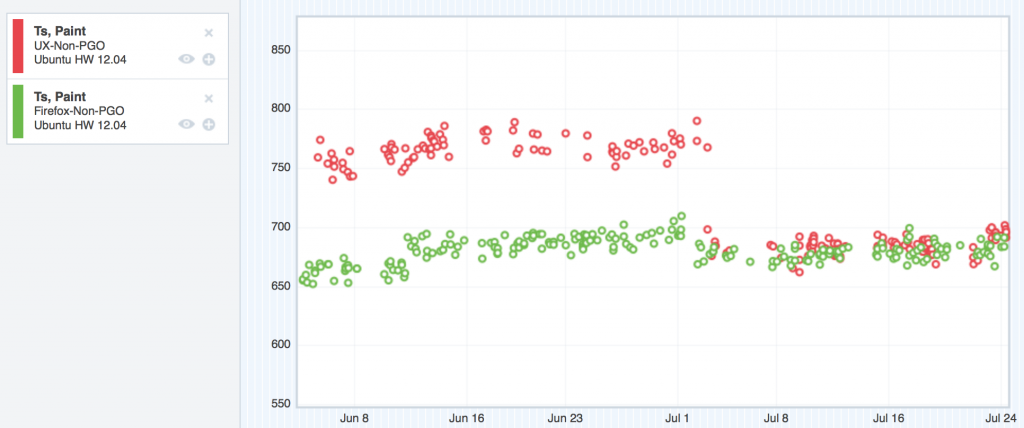
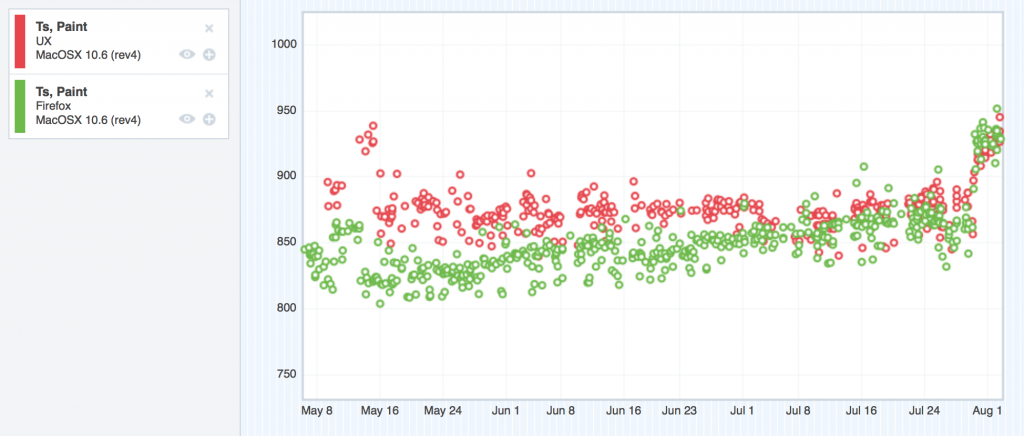
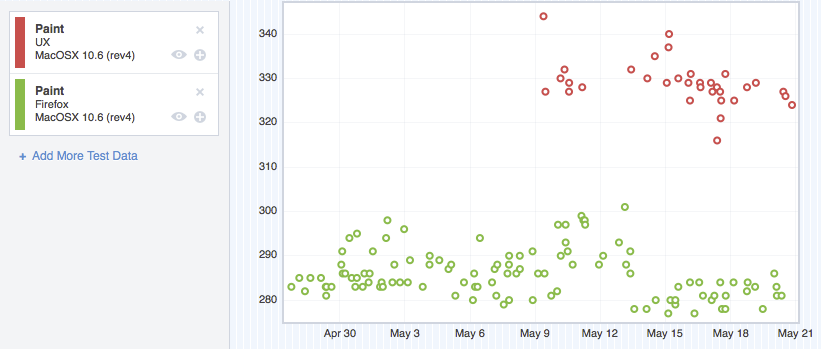
My hypothesis is that this was when we were dealing strictly with the ts_paint / tpaint regression on Windows XP. Take a look at the graphs in my last post again. Notice how UX (red) and mozilla-central (green) converge at around July 1st on Ubuntu? And how OS X finally converges on t_paint around August 1st?

I haven’t included the Windows 7 and 8 platform graphs, but I’m reasonably certain that at this point, Windows XP was the last regressing platform on these tests.

And I know for a fact that we were having difficulty using the Gecko Profiler on Windows XP, due to this bug.

Basically, on Windows XP, the call tree wasn’t interleaving the Javascript and native-code calls properly, so we couldn’t trust the order of tree, making the profile really useless. This was a serious problem, and we weren’t sure how to workaround it at the time.

And so I imagine that this is what prompted jaws to write the homebrew profiler. And it worked – we were able to find sections of CustomizableUI that were causing unnecessary reflow, or taking too long doing things that could be shortcutted.

I don’t know where jaws’ homebrew profiler is – I don’t have the patch on my machine, and somehow I doubt he does too. It was a tool of necessity, and I think we moved past it once we sorted out the Windows XP stack interleaving thing.

And how did we do that, exactly?

Using the Gecko Profiler on Windows XP

jaws profiler got us some good data, but it was limited in scope, since it only paid attention to CustomizableUI. Thankfully, at some point, Vladan from the Perf team figured out what was going wrong with the Gecko Profiler on Windows XP, and gave us a workaround that lets us get proper profiles again. I have since updated the Gecko Profiler MDN documentation to point to that workaround.

Reflow Profiles

This is where we start getting into some really neat stuff. So while we were hacking on ts_paint and tpaint, Markus Stange from the layout team wrote a patch for Gecko to take “reflow profiles”. This is a pretty big deal – instead of telling us what code is slow, a reflow profile tells us what things take a long time to layout and paint. And, even better, it breaks it down by DOM id!

This was hugely powerful, and I really hope something like this can be built into the Gecko Profiler.

Markus’ patch can be found in this bug, but it’ll probably require de-bitrotting. If and when you apply it, you need to run Firefox with an environment variable MOZ_REFLOW_PROFILE_FILE pointing at the file you’d like the profile written out to.

Once you have that profile, you can view it on Markus’ special fork of the Gecko Profiler viewer.

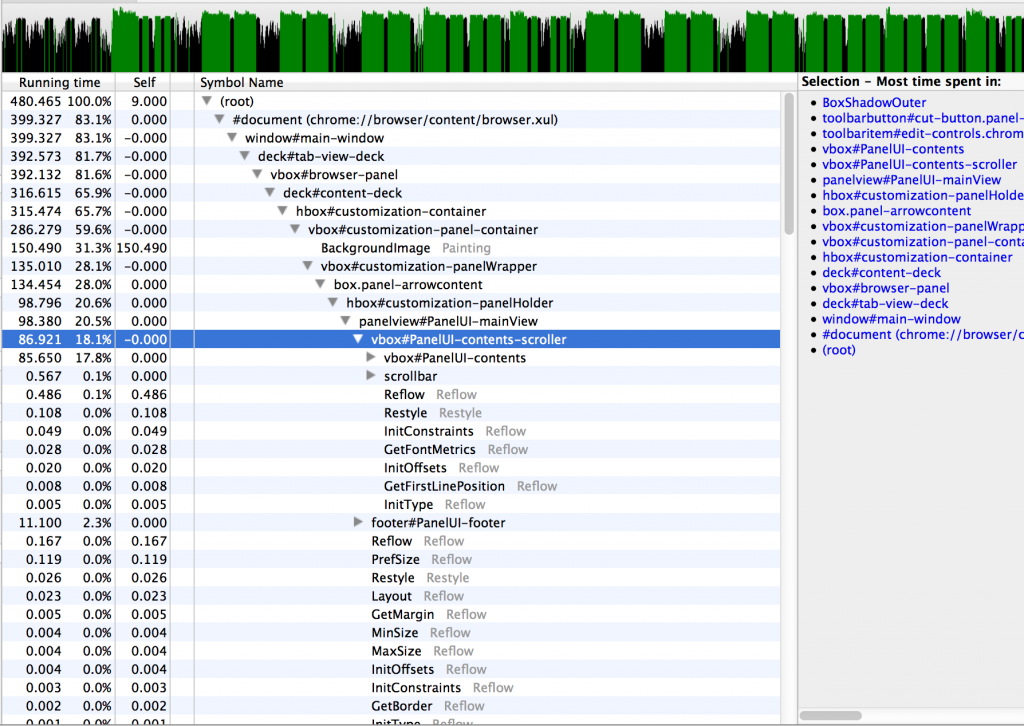
This is what a reflow profile looks like:

Screen Shot 2013-12-13 at 11.49.34 PM

I haven’t linked to one I’ve shared because reflow profiles tend to be very large – too large to upload. If you’d like to muck about with a real reflow profile, you can download one of the reflow profiles attached to this bug and upload it to Markus’ Gecko Profiler viewer.

These reflow profiles were priceless throughout all of the Australis performance work. I cannot stress that enough. They were a way for us to focus on just a facet of the work that Gecko does – layout and painting – and determine whether or not our regressions lay there. If they did, that meant that we had to find a more efficient way to paint or layout. And if the regressions didn’t show up in the reflow profiles, that was useful too – it meant we could eliminate graphics and layout from our pool of suspects.

Comparison Profiles

Profiles are great, but you know what’s even better? Comparison profiles. This is some more Markus Stange wizardry.

Here’s the idea – we know that ts_paint and tpaint have regressed on the UX branch. We can take profiles of both the UX and mozilla-central. What if we can somehow use both profiles and find out what UX is doing that’s uniquely different and uniquely slow?

Sound valuable? You’re damn right it is.

The idea goes like this – we take the “before” profile (mozilla-central), and weight all of its samples by -1. Then, we add the samples from the “after” profile (UX).

The stuff that is positive in the resulting profile is an indicator that UX is slower in that code path. The stuff that is negative means that UX is faster.

How did we do this? Via these scripts. There’s a script in this repository called create_comparison_profile.py that does all of the work in generating the final comparison profile.

Here’s a comparison profile to look at, with mozilla-central as “before” and UX as “after”.

Now I know what you’re thinking – Mike – the root of that comparison profile is a negative number, so doesn’t that mean that UX is faster than mozilla-central?

That would seem logical based on what I’ve already told you, except that talos consistently returns the opposite opinion. And here’s where I expose some ignorance on my part – I’m simply not sure why that root node is negative when we know that UX is slower. I never got a satisfying answer to that question. I’ll update this post if I find out.

What I do know is that drilling into the high positive numbers of these comparison profiles yielded very valuable results. It allowed us to quickly determine what was unique slow about UX.

And in performance work, knowing is more than half the battle – knowing what’s slow is most of the battle. Fixing it is often the easy part – it’s the finding that’s hard.

Oh, and I should also point out that these scripts were able to generate comparison profiles for reflow profiles as well. Outstanding!

Profiles from Talos

Profiling locally is all well and good, but in the end, if we don’t clear the regressions on the talos hardware that run the tests, we’re still not good enough. So that means gathering profiles on the talos hardware.

So how do we do that?

Talos is not currently baked into the mozilla-central tree. Instead, there’s a file called testing/talos/talos.json that knows about a talos repository and a revision in that repository. The talos machines then pull talos from that repository, check out that revision, and execute the talos suites on the build of Firefox they’ve been given.

We were able to use this configuration to our advantage. Markus cloned the talos repository, and modified the talos tests to be able to dump out both SPS and reflow profiles into the logs of the test runs. He then pushed those changes to his user repository for talos, and then simply modified the testing/talos/talos.json file to point to his repo and the right revision.

The upshot being that Try would happily clone Markus’ talos, and we’d get profiles in the test logs on talos hardware! Brilliant!

Extracting and symbolicating those profiles would be handled by more of Markus’ scripts – see get_profiles.py.

Now we were cooking with gas – reflow and SPS profiles from the test hardware. Could it get better?

Actually, yes.

Getting the Good Stuff

When the talos tests run, the stuff we really care about is the stuff being timed. We care about how long it takes to paint the window, but not how long it takes to tear down the window. Unfortunately, things like tearing down the window get recorded in the SPS and reflow profiles, and that adds noise.

Wouldn’t it be wonderful to get samples just from the stuff we’re interested in? Just to get samples only when the talos test has its stopwatch ticking?

It’s actually easier than it sounds. As I mentioned, Markus had cloned the talos tests, and he was able to modify tpaint and ts_paint to his liking. He made it so that just as these tests started their stopwatches (waiting for the window to paint), an SPS profile marker was added to the sample taken at that point. A profile marker simply allows us to decorate a sample with a string. When the stopwatch stopped (the window has finished painting), we added another marker to the profile.

With that done, the extraction scripts simply had to exclude all samples that didn’t occur between those two markers.

The end result? Super concentrated profiles. It’s just the stuff we care about. Markus made it work for reflow profiles too – it was really quite brilliant.

And I think that pretty much covers it.

Lessons

  • If you don’t have the tools you need, go get them.
  • If the tools you need don’t exist, build them, or find someone who can. That someone might be Markus Stange.
  • If the tools you need are broken, fix them, or find someone who can.

So with these amazing tools we were eventually able to grind down our ts_paint and tpaint regressions into dust.

And we celebrated! We were very happy to clear those regressions. We were all clear to land!

Or so we thought. Stay tuned for Part 4.
Australis Performance Post-mortem Part 2: ts_paint and t_paint

Continued from Part 1.

So we’d just gotten Talos data in, and it looked like we were regressing on ts_paint and tpaint right across the board.

Speaking just for myself, up until this point, Talos had been a black box. I vaguely knew that Talos tests were run, and I vaguely understood that they measured certain performance things, but I didn’t know what those things were nor where to look at the results.

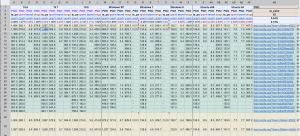
Luckily, I was working with some pretty seasoned veterans. MattN whipped up an amazing spreadsheet that dynamically pulled in the Talos test data for each platform so that we could get a high-level view of all of the regressions. This would turn out to be hugely useful.

Here’s a link to a read-only version of that spreadsheet in all of its majesty. Or, if that link is somehow broken in the future, here’s a screenshot:

Numbers!

Numbers!

So now we had a high-level view of the regressions. The next step was determining what to do about it.

I should also mention that these regressions, at this point, were the only big things blocking us from landing on mozilla-central. So naturally, a good chunk of us focused our attention on this performance stuff. We quickly organized a daily standup meeting time where we could all get together and give reports on what we were doing to grind down the performance issues, and what results we were getting from our efforts.

That chunk of team, however, didn’t initially include me. I believe Gijs, Unfocused, mikedeboer and myself kept hacking on customization and widget bugs while jaws and MattN dug at performance. As time went on though, a few more of us eventually joined MattN and jaws in their performance work.

The good news in all of this is that ts_paint and tpaint are related – both measure the time it takes from issuing the command to open a browser window to actually painting it on the screen. ts_paint is concerned with the very first Firefox window from a cold-start, and tpaint is concerned with new windows from an already-running Firefox. It was quite possible that there was some overlap in what was making us slow on these two tests, which was somewhat encouraging.

The following bugs are just a subset of the bugs we filed and landed to improve our ts_paint and tpaint performance. Looking back, I’m pretty sure these are the ones that made the most difference, but the full list can be found as dependencies of these bugs.

Bug 890105 – TabsInTitleBar._update should group measurements and style changes to avoid unnecessary reflows

After a bit of examination, MattN dealt the first blow when he filed Bug 890105. The cross-platform code that figures out how best to place the tabs in the titlebar (while taking into account things like the system font size) is run before the window first paints, and it was being inefficient.

By inefficient, I mean it was causing more reflows than necessary. Here’s some information on reflows. The MDN page states that the article is obsolete, but the page still does a pretty good job of explaining what a reflow is.

The code would take a measurement of something on the page (causing a reflow), update that thing’s size (causing a reflow), and then repeat the process. MattN found we could cluster the measurements into a single pass, and then do all of the changes one after another. This reduced the number of reflows, which helped speed up both ts_paint and tpaint.

And boom, we saw our first win for both ts_paint and tpaint!

Bug 892532 – Add an optional fast-path to CustomizableUI.isWidgetRemovable

jaws found the next big win using a home-brewed profiler. The home-brewed profiler simply counted the number of times we entered and exited various functions in the CustomizableUI code, and recorded the time it took from entering to exiting.

I can’t really recall why we didn’t use the SPS profiler at this point. We certainly knew about it, but something tells me that at this point, we were having a hard time getting useful data from it.

Anyhow, with the home-brew profiler, jaws determined that we had the opportunity to fast-path a section of our code. Basically, we had a function that takes the ID of a widget, looks for and retrieves the widget, and returns whether or not that widget can be removed from its current location. There were some places that called this function during window start-up, and those places already had the widget that was to be found. jaws figured we could fast-path the function by being able to pass the widget itself rather than the ID, and skip the look-up.

Bug 891104 – Skip calling onOverflow during startup if there wasn’t any overflowed content before the toolbar is fully initialized

It was MattN’s turn again – this time, he found that the overflow toolbar code for the nav-bar (this is the stuff that handles putting widgets into the overflow panel if the window gets too small) was running the overflow handler as soon as the nav-bar was initted, regardless of whether anything was overflowed. This was causing a reflow because a measurement was on the overflowable toolbar to see if items needed to be moved into the overflow panel.

Originally, the automatic call of the overflow handler was to account for the case where the nav-bar is overflowed from the very beginning – but jaws made it smarter by attaching an overflow handler before the CSS attribute that made the toolbar overflowable was applied. That meant that if the nav-bar would only call the overflow handler if it really needed to, as opposed to every time.

Bug 898126 – Cache client hit test values

Around this time, a few more people started to get involved in Australis performance work. Gijs and mstange got a bug filed to investigate if there was a way to make start-up faster on Windows XP and 7. Here’s some context from mstange in that bug in comment 9:

It turns out that Windows XP sends about 200 WM_NCHITTEST events per second when we open a new window. All these events have the same position – possibly the current mouse position. And all the ClientMarginHitTestPoint optimizations we’ve been playing with only make a difference because that function is called so often during the test – one invocation is unnoticeably quick, but it starts to add up if we call it so many times.

This patch makes sure that we only send one hittest event per second if the position doesn’t change, and returns a cached value otherwise.

After some fiddling about with cache invalidation times, the patch landed, and we saw a nice win on Windows XP and 7!

Bug 906075 – Only send toolbars through buildArea if they’re not in their default state

It was around now that I started to get involved with performance work. One of my first successful bugs was to only run a toolbar through CustomizableUI’s buildArea function if the toolbar was not starting in a default state. The buildArea function’s job is to populate a customizable area with only the things that the user has moved into the area, and remove the things that the user has taken out. That involves cycling through the nodes in the area to see if they belong, and that takes time. I wrote a patch that cached a “dirty” state on a toolbar to indicate that it’d been customized in the past, and if we didn’t see that value, we didn’t run the toolbar through the function. Easy as pie, and we saw a little win on both ts_paint and tpaint on all platforms.

Bug 905695 – Skip checking for tab overflows if there is only one tab open

This was another case where we had an unnecessary reflow during start-up. And, like bug 891104, it involved an overflow event handler running when it really didn’t need to. jaws writes:

If only one tab is opened and we show the left/right arrows, we are actually removing quite a bit of space that could have been used to show the tab. Scrolling the tabbox in this state is also quite useless, since all the user can do is scroll to see the other parts of the *only* tab.

If we make this change, we can skip a synchronous reflow for new windows that only have one tab.

Which means we could skip a reflow for all new windows. Are you starting to notice a pattern? Sections of our code had been designed to operate the same way, regardless of whether or not it was in the default, common case. We were finding ways of detecting the default case, and fast-pathing them.

Chalk up another win!

Bug 907787 – Australis: toolbar overflow button should be hidden by default

Yet another example where we could fast-path the default case. The overflow button in the nav-bar is only supposed to be displayed if there are too many items in the nav-bar, resulting in some getting put into the overflow panel, which anchors on the overflow button.

If nothing is being overflowed and the panel is empty, the button should not be displayed.

We were, however, displaying the button by default, and then hiding it when we determined that nothing was overflowed. Bug 907787 inverted that logic, and hid the button by default, and only showed it when things got overflowed (which was not the default case).

We were getting really close to performance parity with mozilla-central…

Bug 908326 – default the navbar to overflowable to avoid needless reflowing

Once again, an example of us not greasing the default-path. Our overflowable toolbar code applies an overflowable attribute to the nav-bar in order to apply some CSS styles to give the toolbar its overflowing properties. Adding that attribute dynamically means a reflow.

Instead, we just added the attribute to the node’s definition in browser.xul, and dropped that unnecessary reflow like a hot brick.

So how far had we come?

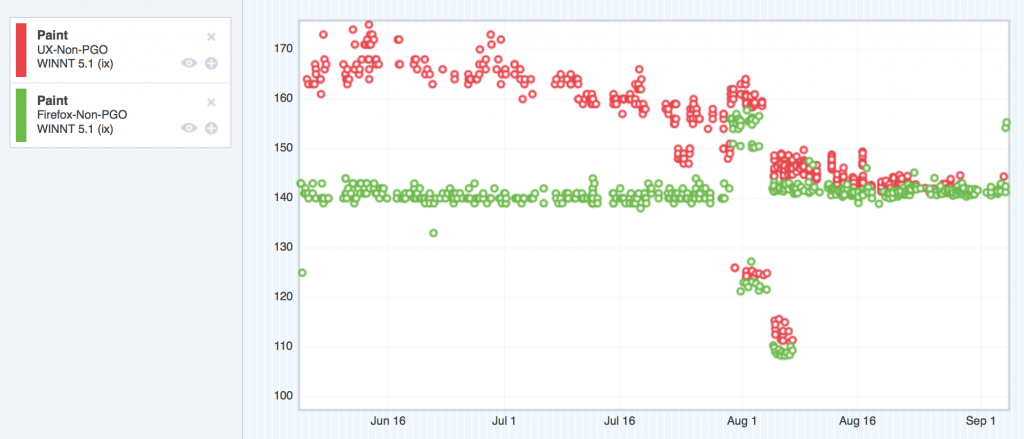
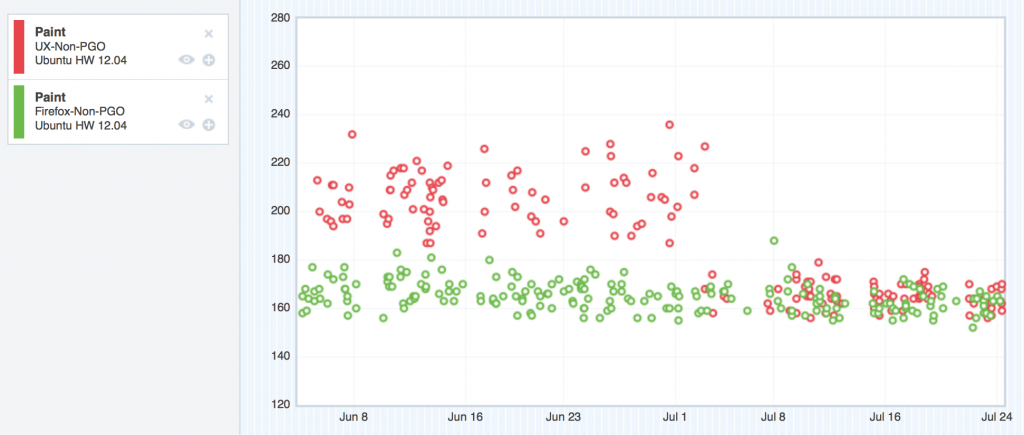
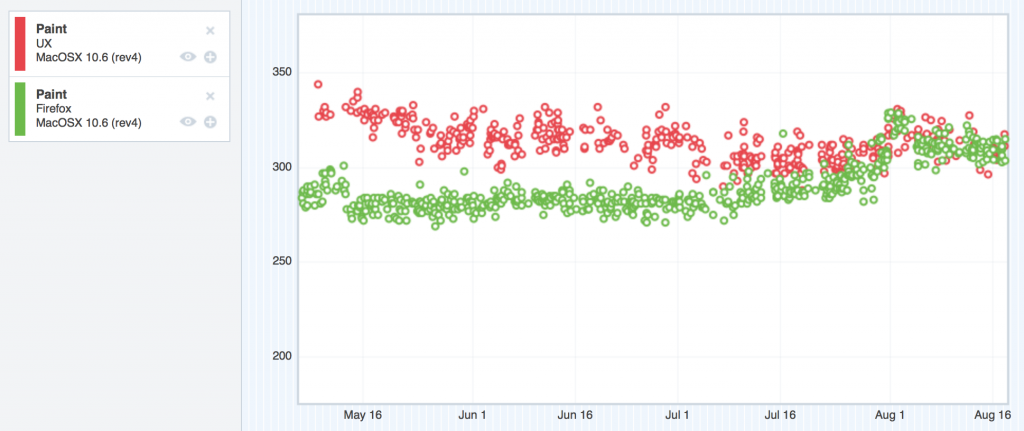
Let’s take a look at the graphs, shall we? Remember, in these graphs, the red points represent UX, and the green represent mozilla-central. Up is bad, and down is good. Our goal was to sink the red dots down into the noise of the green dots, which would give us performance parity.

ts_paint

Windows XP - ts_paint improvements

Windows XP – ts_paint improvements

Ubuntu - ts_paint improvements

Ubuntu – ts_paint improvements

OSX 10.6 ts_paint improvements

OSX 10.6 ts_paint improvements

You might be wondering what that bug jump is for ts_paint for OSX 10.6 at the end of the graph. This thread explains.

tpaint

Windows XP - tpaint improvements

Windows XP – tpaint improvements


Ubuntu - tpaint improvements

Ubuntu – tpaint improvements

OSX 10.6 tpaint improvements

OSX 10.6 tpaint improvements

Looking good.

The big lessons

I think the big lesson here is to identify the common, default case, and optimize it as best you can. By definition, this is the path that’s going to be hit the most, so you can special-case it, and build in fast paths for it. Your users will thank you.

Close the feedback loop as much as you can. To test our theories, we’d push our patches to try and use compare-talos to compare our tpaint and ts_paint numbers to baseline pushes to see if we were making improvements. This requires several hours for the try builds to complete. This is super slow. Release Engineering was awesome and lent us some Windows XP talos slaves for us to experiment on, and that helped us close the feedback loop a lot. Don’t be afraid to ask Release Engineering for talos slaves.

Also note that while it’s easy for me to rattle off bug numbers and explain where we were being slow, all of that investigation and progress occurred over several months. Performance work can be really slow. The bottleneck is not making the slow code faster – the bottleneck is identifying where the slow code is. Profiling is the key here. If you’re not using some kind of profiler while doing performance work, you’re seriously impeding yourself. If you don’t have a profiler, build a simple one. If you don’t know how to build a simple one, find someone who can.

I mentioned Gecko’s built-in SPS profiler a few paragraphs back. The SPS profiler was instrumental (pun intended) in getting our performance back up to snuff. We also built a number of tools alongside the SPS profiler to help us in our analyses.

Read up about those tools we built in Part 3…

Australis Performance Post-mortem Part 1: Where We Started

Getting to the merge

Last Monday, November 18th, Australis merged into our Nightly release channel, meaning lots of people are getting to try it and give us feedback. It’s been an exciting week, and we’re all very pleased with the response so far!

Up until then, if you wanted to try Australis, you had to use the Nightlies from the UX branch. If you followed along on the UX branch, you’ll know that the tabs and the customization work have been in a pretty steady state for the last few months.

So what was the hold up? Why did it take so long to get to the merge?

Gather round folks, I have a story to tell.

Some terminology

I’m going to be batting around a few terms here, and some people will understand them right away, and some people won’t, so I’ll just spell them out here, in no particular order:

Australis
If at this point you’re still not sure what I mean by Australis, you might want to check out this blog post and the accompanying video.
mozilla-central
mozilla-central, in this instance, refers to code that did not have the Australis changes in them. In the grand scheme of things, mozilla-central was where non-Australis code went, and then we’d merge those changes into the UX branch.
UX branch
The UX branch was where we were storing all of the Australis code.
Talos
Talos is a series of tests that we can run against a build of Firefox to measure the performance of different things – for example, how long it takes for a window to be opened. As of this writing, Talos tests for Desktop Firefox are run on Ubuntu Linux 12.04, OS X (10.6, 10.7 and 10.8), and Windows (XP, 7 and 8).

Where we started from

Let’s rewind a bunch of months. Let’s go to about early June, 2013. At this time, the curvy tab work was essentially finished on Windows, and had been ported to OS X and Linux. The customization code was still being hacked on, but we felt like we were in a pretty decent place – the team felt like we were ready to merge into mozilla-central to get some real user feedback and testing.

The problem was that up until that point, we hadn’t been running the Talos tests on the UX Branch, which means we didn’t really have a good idea about how we were performing in comparison to mozilla-central.

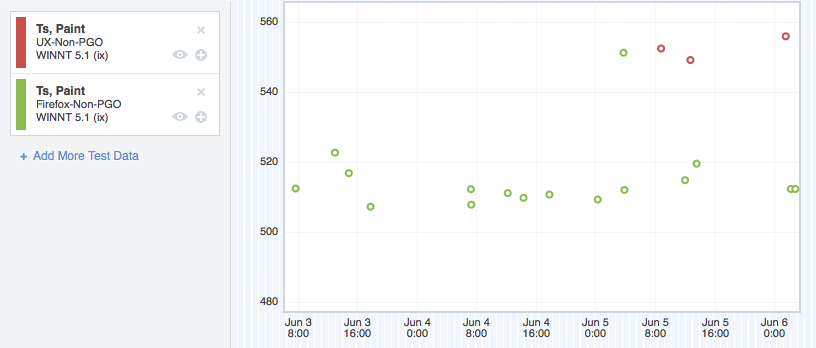
And then we turned the Talos tests on. Data started to flow in, and it wasn’t happy data. In particular, we were regressing pretty badly on two tests: ts_paint and tpaint.

ts_paint
this test measures how long it takes for Firefox to paint the first window on startup.
tpaint
this test measures how long it takes for Firefox to paint a newly opened window from a Firefox that is already running

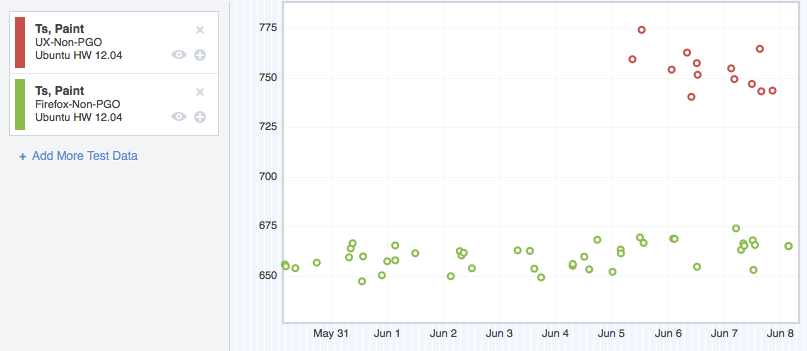
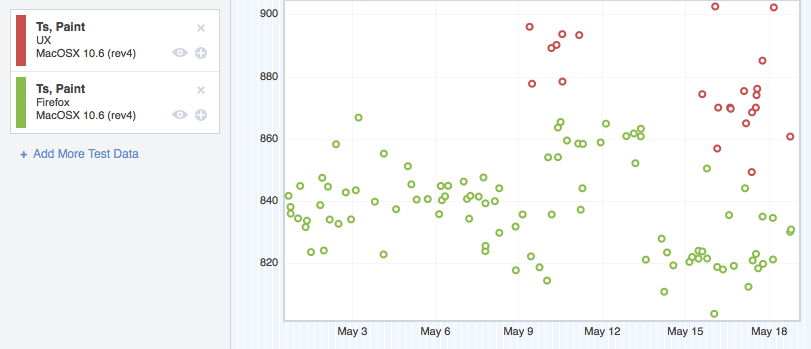
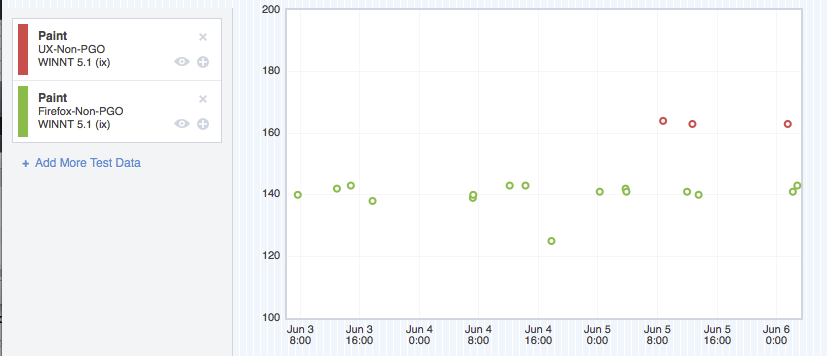
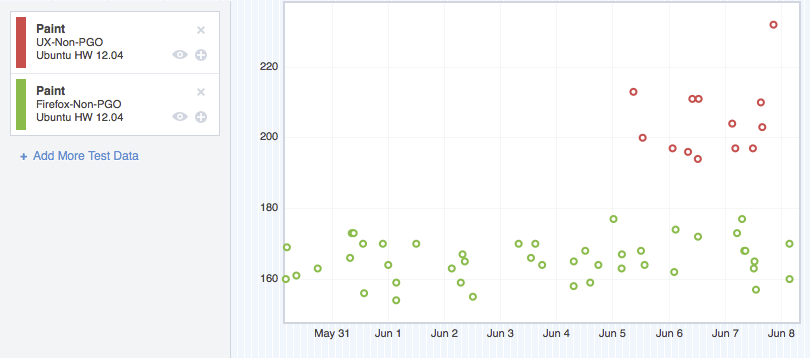
Before I show you this data, I should clear some things up:  as mentioned above, we run these Talos tests on a bunch of operating systems, and a variety of operating system versions. I don’t want to bog this post down with too many charts, so I’m going to extract a chart for each operating system, and forgo breaking it down by operating system version. Suffice it to say that the regressions were pretty consistent from version to version.

Also, in each of these graphs, green represents mozilla-central, and red represents the UX branch. Up is bad (slower). Down is good (faster).

Anyhow, here’s what we saw:

ts_paint

Windows XP - ts_paint regression

Windows XP – ts_paint regression

Linux 32 - ts_paint regression

Ubuntu 12.04 – ts_paint regression

OSX 10.6 - ts_paint regression

OSX 10.6 – ts_paint regression

tpaint

Windows XP - tpaint regression

Windows XP – tpaint regression

Linux 32 - tpaint regression

Ubuntu 12.04 – tpaint regression

OSX 10.6 - tpaint regression

OSX 10.6 – tpaint regression

Ouch

The team has been working like crazy to make Firefox look and feel faster. Hitting a regression like this blows.

It’s also flat out unacceptable to have a regression like this unless there’s a really really good reason for it.

So we had to investigate. What was making us slow? What had we done wrong?

Find out in Part 2.

Australis Curvy Tabs: More Progress!

I wrote a while back about how Matt, Avi Halachmi and I have been ironing out performance problems with the Australis curvy tabs.

Well, it looks like that work is finally paying off.

Our SVG usage seemed to be the big slow-poke, and switching to PNGs gave us the boost that we needed.

But enough squawking, let’s see some charts.

Before Optimizations

Let’s compare – here’s a chart showing the difference between pre-curves and post-curves, before our optimizations:

A graph showing Australis curves performance measurements before optimizations

Here’s the before shot

Note: it’s been a while since I’ve done data visualization work. I think the last time I did this was in grad school. So there might be way better ways of visualizing this data, but I just chose the easiest chart I could manage with Google Docs. Just go with it.

Let me describe what you’re seeing here – we take samples every time a tab opens, and every time a tab closes*. What we’re measuring is the interval time (how long it takes before we start drawing the next frame), and the paint time (how long it takes to actually draw a frame).

The blue bars represent the performance measurements we took on a build using the default theme.  The red bars represent the performance measurements we took using the Australis curvy tabs.

This is where my graph could probably be clearer – in each group of four bars, the left two represent interval times, and the right two represent paint times.

So, hand-wavey interpretation – we regressed in terms of performance in both painting, and frame intervals, for tab opening and closing.

So that’s what we started with. And then we did our optimizations. So where did we get to?

After Optimizations

A graph showing Australis curves performance measurements after optimizations

Here’s the after shot!

The red bars shrunk, meaning that we got faster for both interval and paint times. In fact, for tab close, we beat the old theme! And we’re really super-close for tab open.

Pretty good!

Curvy tabs for all

Last night, Matt landed our optimization patches, as well as preliminary curvy tab work for OSX* and Linux GTK on our UX branch. So, if you’re on the UX branch (and why aren’t you?), you should be receiving a build soon with some curvy tabs. They’re not perfect, not by a long shot, but we’re getting into the polish stage now, which is good.

* Some notes on our measuring methodology. All tests were performed on a low-powered Acer Aspire One netbook. Intel Atom n450 processor (1.66Ghz), 1GB of RAM, running Windows 7. The device has no graphics acceleration support. We also switched to the classic theme to avoid glass. Avi wrote a patch that opened and closed a tab 15 times, and averaging the frame intervals and paint times for each frame. Those were averaged over the 15 openings and closings. We then ran that test 4 times, giving the machine time to “relax” in between, and averaged our results.

* We don’t have hi-dpi support yet, so if you’re on a Mac with a Retina display, your curves might be fuzzy. We’re working on it.

Making Australis Tab Animations Faster

The Firefox desktop team gathered in Toronto a few weeks back to hack together, and to discuss how we’re going to tackle 2013.

I can tell you right now, it’s going to be a fantastic year for Firefox.

Asa Dotzler has a great high-level write-up of some of the stuff we talked about, but I want to focus in on something Matt Noorenberghe and I were working on: beautiful curvy tabs.

An Australis tabs mockup

Mmmmm…that’s the stuff.

That’s what I’m talking about, right there.

These curvy-tabs are already available for Windows in the UX Nightly builds, and I’ve been using them for a few weeks. And they feel great. It’s actually painful to go back to the boxy, noisy, square tabs in the current default theme. Using the old boxy tabs feels like I’ve gone back in time – and not in a cool way.

Even Chrome’s 45° angle tabs feel just a little too machine-like and impersonal in comparison, in my opinion.

A screenshot of Google Chrome's tabstrip on OSX

Chrome’s 45° tabs

Having a more fluid and minimal tab strip in Firefox is great, but it’s only great if it performs well. Fluid and fast is the name of the game, and that’s what Matt and I were looking at; we were trying to find ways of speeding up tab opening and closing animations.

We’ve been working with the Performance Team on this, and we’ve been gathering some really interesting data. Probably the most interesting stuff is when we make a change that we expect to improve performance, and it doesn’t deliver. Or, even worse, it causes performance to be poorer. That’s usually a very surprising result.

We ran into such a result late last week, when we tried changing how we put a gradient on top of the selected and hovered tabs. We had originally been using the CSS linear-gradient function, and the Graphics Team told us that using a tiled background-image with some opacity (like a PNG) would improve performance.

Well, we generated our gradient as a PNG, tossed it in, and did our measurements. Lo and behold, performance worsened somewhat, and we’re still not exactly sure why. I’ve filed a bug on this, and I’m hoping we can get it resolved soon. Switching to PNGs for gradients was supposed to be an easy win, and the Graphics Team was pretty surprised by our result.

Matt and I tried a bunch of different ideas to speed up tab animations, and slowly but surely, the needle started to move in our favour. We’re getting close to matching the performance of the current square tabs, but we’re going to see if we can push it over the edge and bank ourselves an overall performance win.

Fluid is good, but fluid and fast is the best. We’re getting there.